The Money Flow Index is an indicator (from a group of oscillators) used as part of the FX market tech analysis. The tool was developed by traders Gene Quong and Avrum Soudack, and the principles of its use were described in detail more than 30 years ago. What is its essence, and why should traders and investors know about it? Essentially, the indicator gauges the pressure of buyers and sellers. MFI reflects the intensity with which funds are invested in or withdrawn from an asset.
The MFI is often compared to the more popular RSI (Relative Strength Index), but unlike the RSI, the MFI also takes into account trading volume. The tool can hardly be called popular, however, it can be useful for traders to determine entry points. In this article, we will tell you how to calculate the oscillator, how to interpret its signals, and how to use money flow index indicator on a practical level.
Understanding Money Flow Index
What is money flow index? This is quite simple to understand: the indicator calculates the difference between incoming and outgoing cash flows. If the underlying value of the asset is below this difference, there is an increase in the incoming money supply and the market is bullish. If we see the opposite, it means investors are leaving the asset and the market is bearish.
Thus, MFI compares the ratio of positive and negative cash flows. If the current price is higher than for the previous period, this indicates a positive flow of money into the asset. If it is less, it means that investors are withdrawing funds from this asset.
MFI Calculation
At the heart of the Money Flow Indicator is its unique calculation, which sets it apart from other indicators by incorporating volume. It starts by identifying the typical price of an asset. Here is how you can find it:
Typical Price = (High + Low + Close) / 3
In the second step, you can determine the raw money flow by this formula:
Raw Money Flow = Typical Price x Volume
To get positive money flow, you should add the MFs for the days when the typical price is bigger than the previous day.
The calculation of the negative money flow is done in the same way.
The ratio between the Positive MF and Negative MF is the money ratio.
Now, you can employ the following formula to finally calculate the money flow index:
Money Flow Index = 100 - [100 / (1 + Money Flow Ratio)]
Usually, the indicator tracks data from the 14 days.
Interpreting MFI Readings
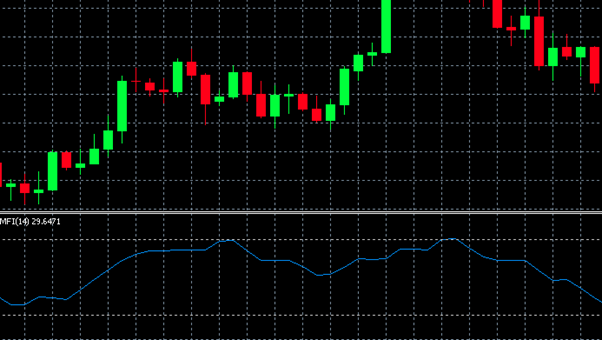
Interpretation of MFI signals is similar to RSI analysis. However, there is a slight difference. Since the index takes into account market volume, its curve will differ from the RSI. Here are some basic rules for understanding signals:
- If the MFI indicator is trading between 20 and 80, watch for it to approach 50. When it is above 50, the buying pressure appears. When it falls below 50, there is pressure caused by sellers.
- When you see the oscillator fall below 20, it could mean it's time to buy. When it gets above 80, it might be time to sell.
In addition, it makes sense to monitor overbought or oversold conditions, as well as the divergence between the price and the indicator. Keep reading for more details.
Overbought and Oversold Conditions
Since the Forex money flow index indicator is a typical oscillator, attention should be paid to the indicator line leaving the overbought or oversold zones. Moreover, when a trend begins, the Money Flow Index, like all other oscillators, can get stuck in the corresponding zone for a long time. Therefore, to select the optimal entry and exit points, the indicator needs a trend filter.
The traditional overbought zone begins above 80, and the oversold one begins below 20. However, these values are subjective, and you can certainly set whatever thresholds work best for the tool (e.g. 10 and 90). In this case, you will receive fewer signals, but they will be stronger.
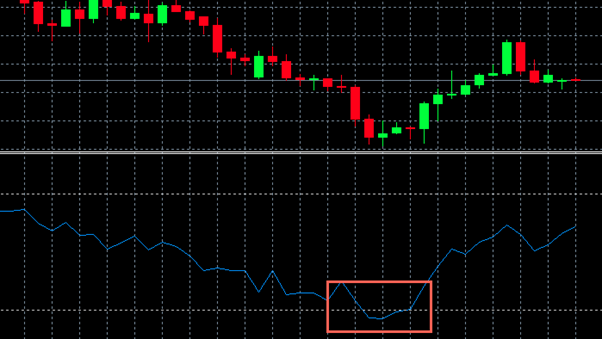
Divergence with Price
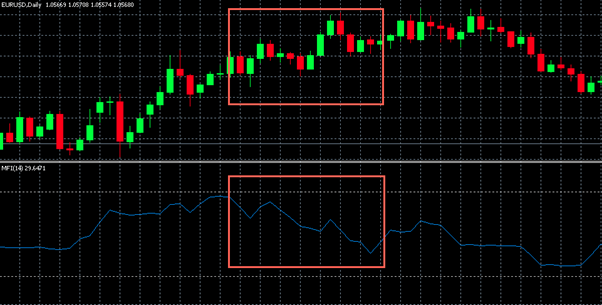
Sometimes, you can see that the indicator and the price are moving in different directions. Suppose, for example, that the price of an asset rises. But you see that the oscillator is falling. In such a situation, buying pressure decreases. When this happens in the market, traders can interpret it as a sure sign that the price will soon reverse in the direction of the technical indicator. MFI divergence is not a 100% effective signal, but it is one of the most accurate reversal signals. The larger the timeframe for using the indicator, the more accurately the divergence is processed.
Money Flow Index Trading Strategies
How to use MFI indicator in Forex trading? To answer this question, you should come up with a certain strategy. The MFI is an oscillator that often produces powerful signals. In addition, it is not difficult to use — even beginners can handle it. Therefore, when you are developing a trading strategy, take this index into account. You can use it for both "reversal strategies" and "trend strategies" to determine entry and exit points.
If in doubt, it is always appropriate to practice on a demo account. This will allow you to enter trading without putting your capital at risk. The second one, which will help you create a profitable strategy, is the use of the best Forex robots advisors. These programs automatically analyze hundreds of indicators and make fairly accurate recommendations. If you want to learn to understand MFI yourself, below are two ways to use it.
Confirmation of Trends
Observing the level of the indicator and its divergence from the price are quite strong signals that can be included in your trading strategy. Moreover, the indicator can help according to the well-known principle: "The trend is your friend." This is especially worth considering for beginners. The Money Flow Index is a universal indicator suitable not only for finding reversals. Also, it is capable of giving signals about the beginning of a trend and its strength. This is because the MFI Forex takes into account trading volume, which, in turn, is the basis of price direction.
Initially, you must focus on the middle of the range — level 50. This conditional line separates the bulls and bears. Next, you need to watch the oversold zone. When the indicator curve turns in the area below 20 and moves up crossing the middle, we can say that there is a bullish trend in the market, and it will develop further. The same is true with a bearish trend, only in this case the reversal occurs in the overbought zone and moves downwards. As mentioned earlier, the signal is considered a fairly reliable trend confirmation since it is based not only on changes in typical prices but also on volumes.
Identifying Potential Reversals

Another way to use the oscillator is to search for the moment to close a position. That is, we do not use a fixed take profit but wait for a market signal. The easiest way to understand this process is with a concrete example. Let's assume that a bullish trend is developing, and you have opened a buy position. The price is rising, the indicator value is also moving up. You wait until the indicator line begins to reverse.
It is important to remember that the MFI curve may remain in the overbought or oversold zone for a long time. Therefore, entering these areas is not a signal. The position should be closed only when the line leaves the zone in the opposite direction. This will clearly indicate a slowdown in the trend and, possibly, a flat in the market. However, in most cases, this scenario will show a real price reversal.
Practical Tips for Using MFI
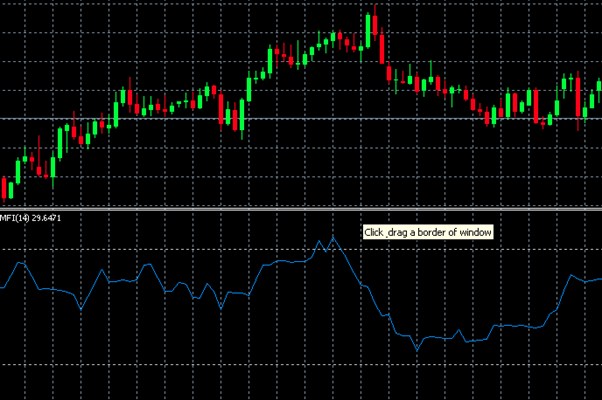
When you know what is MFI indicator, you can start applying it. If you use Meta Trader 4, you can find it in the "Indicators" — "Volumes" section. When you click on "Money Flow Index," a setting window will appear. By default, MFI is calculated based on a 14-day period, but this value can be changed depending on your trading strategy and market conditions.
Timeframe Considerations
If you want to customize the oscillator, you can do so in the settings. A short period may make the MFI more sensitive to changes, but it may also result in more false signals. A longer period may smooth out the indicator and reduce the number of false signals, but it may be less useful for short-term analysis.
Combining with Other Indicators
You also need to understand that MFI perfectly complements other technical indicators. For example, you can use trend indicators such as moving averages to confirm the direction of the trend or volatility indicators to recognize potential entry and exit levels.
Common Mistakes to Avoid
Beginners who are getting acquainted with MFIs for the first time tend to overly trust this indicator. However, the list of possible mistakes is a little longer. Here's what to avoid:
- Forgetting about the market context. Look at all the signals and global economic indicators.
- Forgetting that MFIs can give false signals. Check other indicators.
- Not following the risk management strategy. Don't take more risks than necessary.
- Not following your general trading strategy.
Remember that MFIs are only a small part of trading. Use it as a tool, not as an arrow that shows where your money is.
Conclusion
The money flow index indicator is a powerful but, at the same time, incomplete tool. It can be used in a variety of strategies to indicate when to open or close a position or to identify a trend reversal. Unlike the popular RSI, it takes into account trading volume, which largely determines its properties. Use the index wisely, combine it with other instruments, and improve your trading performance.