No matter how complex and numerous trading indicators and candlestick patterns may be, they are necessary for successful trading. Among the dozens of tools that can be found in MT4, MT5, and other trading platforms, a group stands out. These are Forex volume indicators. They help accurately predict price changes, making the trading strategy more effective.
The signals a trader receives from this group of indicators have varying degrees of accuracy. They often must be used in conjunction with other tools. This article will look at a list of Forex volume indicators that professional traders use most often. These include OBV, A/D, VPT, Chaikin Oscillator, and Fixed Range Volume Profile. You'll learn how to use volume indicators in Forex, find them in your trading platform, and make them a part of your strategy.
What is Volume in Forex Trading?
In simple terms, volume in Forex is the amount of currency bought and sold on the market over a certain period. It is an essential parameter, as it reflects traders' sentiment and shows how strong market trends are. It is critical to analyze volume together with price and momentum. In this case, this combination will help to make the most accurate forecasts.
In addition to relating volume to the direction and strength of the trend, it provides insight into market liquidity. Obviously, with high volume, the market is crowded with traders, and you can open and close positions much faster. The spread will be minimal. This applies to currencies such as USD/EUR, USD/GBP, EUR/GBP, and other major pairs. However, the market is less liquid with low volume, and transactions have larger spreads.
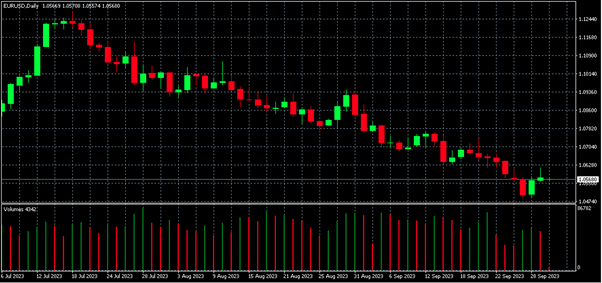
Interpreting Volume Patterns (Volume Spikes and Divergence)
When we look at a market volume trading Forex, we see that it is never static. There are always some ups and downs. Sometimes, there are sharp jumps, which are valuable signals for experienced traders. This phenomenon is quite common, so it is worth understanding it in more detail.
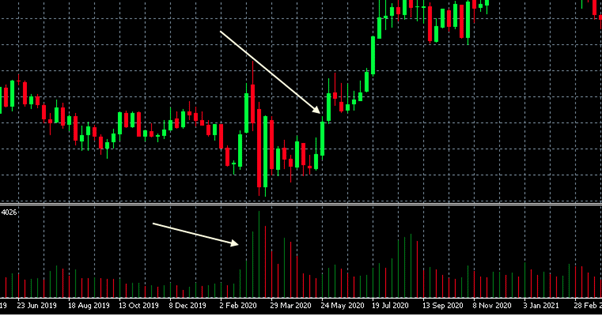
A volume spike is an abnormally sharp increase (or decrease) in the volume of a traded currency. It can reflect the emotional state of traders — sudden interest or, conversely, fear. Such peaks often anticipate price changes. However, decisions should never be made based on this Forex trading volume indicator alone. It is necessary to look for confirmation of a trend change from other indicators.
Divergence is a popular term in Forex. It means that the price curve goes in one direction, and the curve of another indicator (in our case, volume) goes in the other. This often signals the weakness of the current trend and its possible reversal. As with spikes, you must consider other tools, such as moving averages or oscillators.
Divergence and spikes are the most straightforward and prominent visual representations of market volume. They are easily visible on charts and instantly provide valuable information about possible reversals. However, they must be combined with other tools to avoid mistakes.
How to Calculate Volume in Forex
Unlike many other indicators, volume cannot be calculated using any formula. This parameter requires receiving a huge amount of data from the Forex market in real time. A particular broker can take into account the transactions it makes and display them on charts. However, the global Forex daily trading volume remains unaccounted for.
In general, the formula for calculation looks like this:
Trading volume = Number of lots x trade size.
For example, if 10 trades are executed in a certain period, and each trade is equal to 1,000 EUR, the TV will be 10,000 EUR.
What Is a Volume Indicator?
A volume indicator is a technical analysis tool that shows how much currency has been traded over a certain period. It measures the number of transactions and provides traders with this data in graphical form. Volume is a fundamental characteristic of the foreign exchange market, which provides a basic understanding of market liquidity and the strength of trends. Knowing how to use volume indicators is essential for successful Forex trading.
Types of Forex Volume Indicators
There are many volume indicators. Some of them are similar, but there are also differences. Professional traders must be proficient in multiple tools to minimize the likelihood of mistakes. Below are five basic indicators that you can find on any popular trading platform.
On-Balance Volume (OBV)
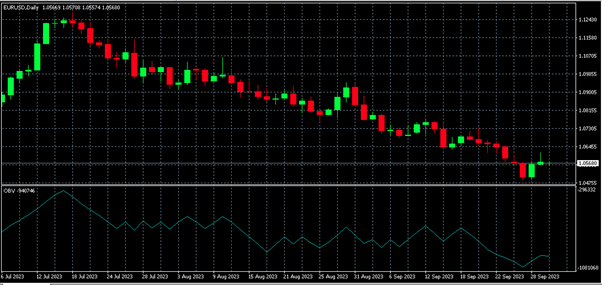
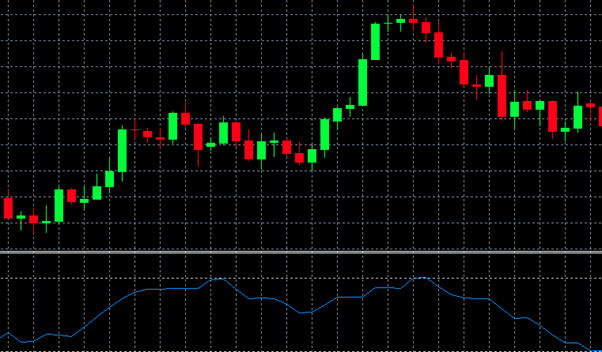
The on-balance volume (OBV) is one of the most popular instruments from this group. It works like this: when the price of a currency pair closes higher than in the previous period, the trading volume for that period is added. If the price closes lower, the volume is deducted. OBV demonstrates the selling and buying pressure that exists in the market.
To view this indicator, you need to activate it in the trading platform (for example, in MT4), and it will appear under the price chart. If the OBV curve goes up, this is an obvious signal of increasing buying pressure. If the spikes in the chart are sharp, it makes sense to check other technical instruments, as the price may rise. OBV is arguably the best volume indicator that you should consider in your strategy.
Accumulation/Distribution (A/D) Indicator
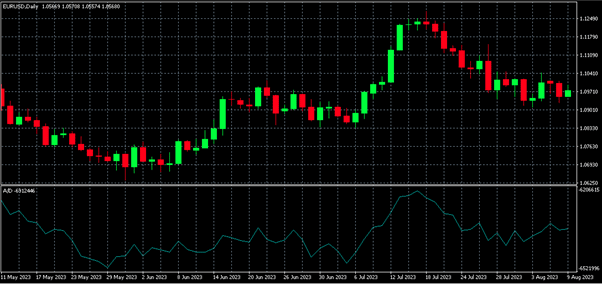
Another popular volume indicator is the accumulation/distribution (A/D) line. It measures the flow of money into or out of a specific asset. Its calculation is also based on changes in price direction relative to the previous period. The A/D formula is slightly different from OBV, but the principle of operation is very similar. If the price closes higher, the trading volume is added, and if it closes lower, it is subtracted. All these fluctuations are displayed on the chart, which is also located below the price chart.
Volume Price Trend (VPT) Indicator
The Volume Price Trend (VPT) indicator significantly differs from the previous two. It takes into account not only the addition or subtraction of trading volume over the period but also the percentage change in price. Therefore, it helps to predict not only the trend change but also the price value.
When you work with VRT, it is essential to consider the deviation from the price curve. It can quickly show a trend reversal and help you open a trade on time. If you are new to trading, it will be helpful for you to learn about possible scenarios for the behavior of the two charts:
- Price and VRT are moving in the same direction. This confirms whether the price trend is upward or downward.
- The price rises, but the VRT falls or stays the same. The bull trend may end soon.
- The price falls, but the VRT rises or remains unchanged. A trend reversal is possible.
These forecasts are superficial and require verification using other technical analysis tools. You must also understand that other volume indicators and their divergence have the same properties. If it seems complicated, you may rely on the best Forex robots that analyze dozens of indicators and assist you in trading.
Fixed Range Volume Profile
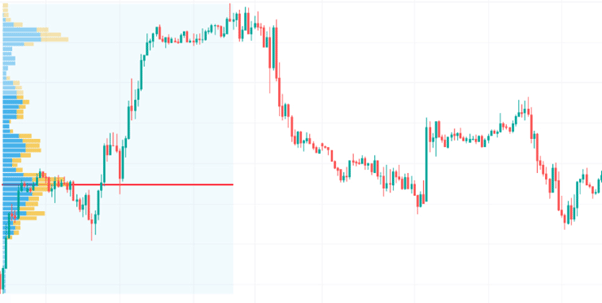
The next volume indicator Forex we will look at is the fixed range volume profile. Its graphical depiction is different from that of other indicators. The volume profile can be found on the x-axis of the price chart, not at the bottom of the screen.
The principle of calculation of this indicator also differs significantly. It focuses on finding the greatest trading activity and the highest volume spikes, which allows you to determine resistance and support levels. Traders use this indicator to determine the approximate price range in which an asset will likely be traded.
Chaikin Money Flow (CMF)
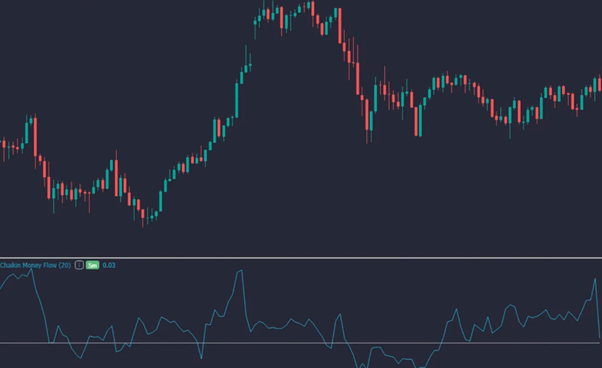
Chaikin Money Flow is an oscillator used to measure trading volume and, therefore, the strength of a trend. Its creator is an experienced trader who invented this indicator for more effective trading. CMF is very popular among professional traders as it provides fairly accurate data.
To begin with, we should talk about the method of calculating the oscillator. First of all, you need to calculate the volume of cash flow. Next, the accumulation/distribution lines are calculated. Only then is the ten-period moving average subtracted from the three-period exponential moving average. This will be the value of the Chaikin oscillator.
It is the best volume indicator Forex displayed in the form of a histogram. It can either rise above the zero level or fall below. Lower histogram values signal a possible price decline, while values above zero indicate a potential bullish trend. It is also essential to pay attention to the size of the bars: the larger the bar, the more the price can change.
Tips for Using Forex Volume Indicators
Let's move on to the practical aspect of volume indicators and look at a few more critical signals that can be a call to action for you:
- A sharp increase in trading volume accompanied by a change in the price of an asset can be an exhaustion move that anticipates the end of a trend. It may be time to open or close a position.
- If the volume changes sharply, this may signal a trend reversal. Test this hypothesis using other indicators.
- A price breakout may be a false signal if trading volume has not changed significantly. You should not make hasty decisions.
- Be sure to study the history of changes in the volume of a certain asset to understand its specifics.
In addition to these fairly simple tips, there are two more that you should always remember. They relate to price confirmation and optimal time frames.
Confirmation with Price Action
Trading volume directly correlates with the price of the asset. It is easy to understand if you know how the market works. Thousands of buyers and sellers constantly exchange one currency for another. If a given currency pair is popular, even more people will want to trade it over time. The volume will increase, and so will the price. The same principle works in the opposite direction. If interest in an asset decreases, volume and price will go down.
Timeframes and Settings
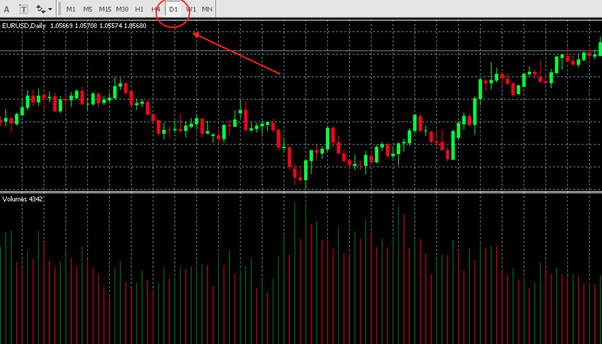
Most often, traders look at the Forex daily volume. For effective analysis, the daily histogram can be compared with the hourly one to open or close positions on time. If you trade long-term and do not want to log into the platform every day, you can set weekly or monthly periods. All necessary settings can be made in the Meta Trader 4 program or other popular trading platforms.
Conclusion
Understanding volume indicators is not only a useful but also a vital skill for a Forex trader. They provide the most basic information about the market and market sentiment. Indicators give insight into the amount of a particular asset being traded among participants. Their number is quite large, but it is enough to know and understand the Top 5 described in this article for successful work. Knowing them lets you determine price reversals, volatility levels, and other vital parameters. This, in turn, will help make more profitable trades.