Today, there are hundreds of technical analysis indicators, but not all are equally useful and effective. Ichimoku Cloud is one of the tools that has proven its effectiveness over decades of use. It gives professional traders a quick insight into the market situation and prevailing trends. In this article, you will learn what is Ichimoku Cloud and how it can help you in your trading.
What is Ichimoku Cloud?
Modern traders owe many technical inventions to Japan. Even the most popular way to display price movements — the candlestick chart — was invented there. However, the Japanese gave the Forex world more than just candles. In the 1930s, Japanese journalist Goichi Hosoda wanted to create a tool that would help traders instantly gauge market sentiment.
The reliability of the Ichimoku Forex method is evidenced by the fact that the tool was refined and improved over three decades and was published only in 1968. This method of technical analysis may seem too complex. It consists of several indicators and provides much data. Thus, from the chart, you can determine possible entry points, support and resistance zones, and even changes in trend.
Components of the Ichimoku Cloud
The Ichimoku Kinko Hyo (the Japanese name of the cloud) comprises five main components. Used together, they increase each other's reliability and provide more accurate trading signals. These are the components:
- The Tenkan-Sen Line, also called the conversion line, shows the average price of an asset over the last nine periods (days).
- The Kijun Sen line, also called the baseline, represents the average line for the last 26 periods. It is used to determine support and resistance levels and confirm a reversal.
- Senkou interval A. This component is calculated from the previous two. It represents a line that can also be used to determine support and resistance.
- Senkou Span B forms the second edge of the cloud and is calculated from 52 previous periods (e.g., days).
- Chikou Span. This element, also called the lagging interval, represents the closing price of the current period plotted on the chart 26 days ago.
Ichimoku Cloud Formulas and Calculation
The formulas for calculating Ichimoku Cloud are relatively easy but require assessing a lot of data. Basically, you can perform it in an Excel spreadsheet, but luckily, trading platforms do it themselves and display the results in a visual format. Here are the formulas they use:
- Conversion Line (Tenkan sen): 9 Period High + 0.5*(9 Period Low)
- Base Line (Kijun sen): 26 Period High + 0.5*(26 Period Low)
- Leading Span A (Senkou span A): Conversion Line + 0.5*(Base Line)
- Leading Span B (Senkou span B): 52 Period High + 0.5*(52 Period Low)
- Lagging Span (Chikou Span): Close-plotted 26 periods in the past
Initially, the period was equal to one day. Now, trading programs allow you to set different timeframes for calculating Ichimoku Kinko Hyo. Below, you'll see the Ichimoku Cloud explained and how to trade with it. Also, you can use the best Forex robots to automate the trading process and ease your life. They will give you many extra points in terms of speed and accuracy.
What Does the Ichimoku Cloud Show?
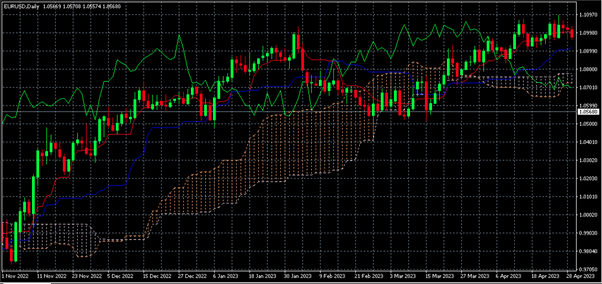
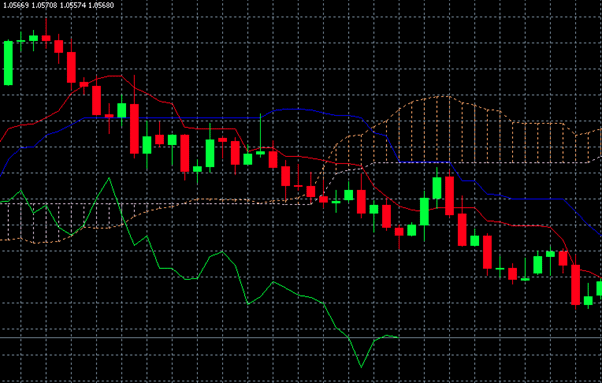
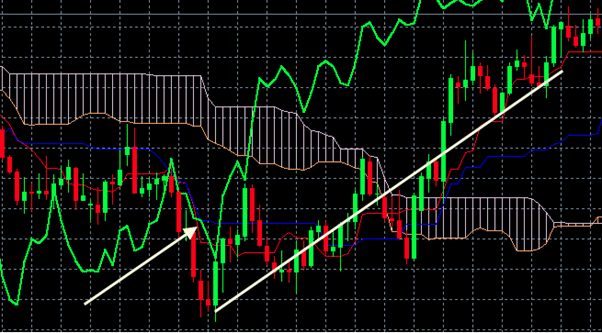
The Ichimoku indicator shows essential data for traders. You can understand a lot just by looking at a graph. So, for example, if the price is above the cloud, a bullish trend will occur. And vice versa: the trend is downward if the price is under the cloud.
Also, the direction of the trend can be understood by the relative position of span A and span B. When the Senkou span A is higher than the leading span B, the space between the lines is colored green, and the direction of the price curve is upward. The same is true for a bearish trend: span A will be under span B in this case.
The price may be very close to the cloud. In that case, it is better to double-check the Ichimoku cloud signal using other technical indicators. This will help you make more accurate decisions and minimize risks.
Reading and Interpreting the Ichimoku Cloud
Beginners often ask: “How to trade Ichimoku Cloud?" The instrument is a combination of several moving averages. It does not consider many important market factors, so it is necessary to use other technical tools. At the same time, Ichimoku Kinko Hyo is such an effective indicator that it allows you to determine many market trends. So, when interpreting the chart, traders can see the following:
- Trend strength. The size of the cloud reflects the strength of support and resistance. Thus, a wide cloud is a clear signal of a powerful price trend and confident behavior of sellers and buyers. And vice versa: a narrow cloud is an indicator of a weak trend.
- Support and resistance levels. To consider these parameters in more detail, we need to examine the upper and lower boundaries of the cloud. Experienced traders can use them to identify potential areas where the price may change.
- Trend direction. As mentioned above, the location of the price curve relative to the Ichimoku cloud determines the prevailing trend. If the market is consolidated, the price will be in the cloud.
- Trend reversals. To determine reversals, you need to look at the intersection of the two leading spans (A and B) and the change in cloud color. If span A moves above span B, this is a signal of an uptrend, and vice versa.
- Buying and selling. These signals can be seen at the intersection points of the conversion and baseline lines. If the CL crosses the BL from bottom to top, this is a buy signal, and if the conversion line crosses the Kijun Sen from top to bottom, it's time to sell. The second important signal is the intersection point of the Chikou Span and the price chart. If it happens from below, it's time to buy, and if it happens from above, it's better to sell.
The tool provides traders with a large amount of important information. If you want to learn how to interpret Ichimoku Cloud and make effective decisions quickly, you need to understand this indicator well.
Ichimoku Cloud Strategies
No successful trading strategy can be built on a single instrument. However, the Ichimoku cloud can be part of successful trading approaches. Below, we will look at three Forex Ichimoku trading strategies: the intersection of the conversion and base lines, cloud breakouts, and waiting for confirmation from Chikou span.
Crossover Signals: Tenkan-sen and Kijun-sen
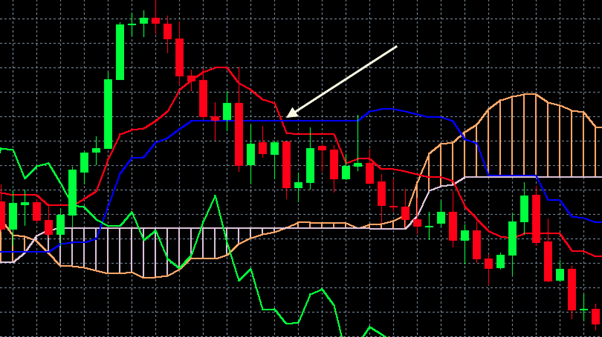
The first strategy we'll examine is looking for the intersection of the conversion line (Tenkan Sen) and the baseline (Kijun Sen). This is one of the most popular Ichimoku signals. We briefly examined it above, and now let's explore the details a little more.
When the Tenkan Sen crosses the Kijun Sen from bottom to top, it makes sense to open a long position. If you plan to sell, you should expect the conversion line to cross the baseline in the opposite direction. Typically, in this Ichimoku trading strategy, traders use additional oscillators to determine the strength and direction of the trend.
Cloud Breakouts
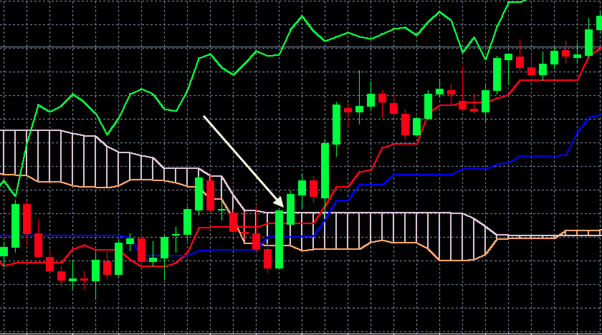
With the second strategy, we examine the price curve and look for points where it breaks through the cloud. Typically, such a signal indicates either a potential reversal or a continuation of the trend. The market is likely to be bullish if the price rises above the cloud and bearish if it falls below it. This Ichimoku trading system does not contradict the first one and can be used in conjunction with it.
Chikou Span Confirmation
The fifth important component of the Ichimoku cloud is the Chikou span. The behavior of this curve forms the basis of the third Ichimoku Cloud strategy. So, if a lagged span rises above the price, this is an uptrend signal. The Chikou span is used to confirm breakouts or vice versa — to filter out false signals. To minimize risks, you can set stop losses at the intersection points.
Limitations on Ichimoku Cloud Usage
A professional trader developed Ichimoku Cloud, and it has successfully performed for a long time. However, like any other technical analysis tool, it has some limitations:
- Lag. Ichimoku Cloud uses historical data from 26 previous periods, so it may be slow to respond to sudden changes in the market, which could lead to false signals.
- Complex visual representation. The indicator overloads the chart, and the simultaneous perception of all components can be complex for beginners. At the same time, trading programs allow you to hide some lines and focus only on those you are studying at a particular moment.
- Subjectivity. A large amount of data can lead to different interpretations. Therefore, it is crucial to know how to use Ichimoku Cloud but not rely on it excessively.
Practical Tips for Using the Ichimoku Cloud in Forex Trading
Now that you know how does Ichimoku Cloud work, it's time to move on to practical aspects. You may know the theory well, but practical advice from leading experts will still help you save a lot of money and time. Below are some details that will help you in your Ichimoku trading:
- If the price chart crosses the cloud, this is a signal to continue or change the trend. However, take your time to make a deal. It is better to open a position after the second candle appears, which confirms the trend.
- You can adjust the number of periods for different curves. It is best to follow the indicator's creator and use the basic settings: 9, 26, and 52.
- The stop loss is usually set at the low of the first candle.
- Use the Ichimoku cloud for time frames of 15 minutes and above. You can also use it for scalping, but the indicator's lagging nature may cause false signals.
Of course, each trader determines the peculiarities of trading with Ichimoku clouds. They depend on the style, risk tolerance, and goals of the Forex market participant. Therefore, creating the best strategy requires experience and the ability to draw conclusions.
The Bottom Line
The discussed indicator may seem too complicated at first glance. However, in reality, the question “How to read Ichimoku Cloud?" is not tough. Essentially, the instrument is a combination of moving averages, which provide a trader with many valuable insights. The chart helps determine the direction and strength of the trend, possible reversals, and potential points for opening a position. It can help you trade more effectively, no matter what level of knowledge or experience you have!