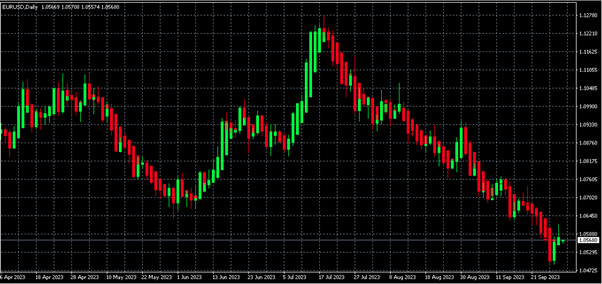
Every trader knows how to use Japanese candlesticks, recognize their patterns, and make trading decisions based on the candlestick chart. This method has been around for hundreds of years and is one of the simplest ways to display information about price movement. However, Japanese candlesticks also have weaknesses. For example, they display even the tiniest fluctuations, making overall analysis difficult.
Heiken Ashi candles were invented to solve this and some other problems associated with traditional price charts. They allow you to remove market noise and give a clearer picture of what is happening in the market. Simply put, Heiken Ashi is the average value of a price chart, but it contains some details that may be useful to professional traders. In this article, we will look closer at the Heikin Ashi candle strategy.
Exploring Heiken Ashi Charts
Heikin Ashi is secondary to the standard candlestick chart. Regular candles show the actual price level on a time frame in real time. Heikin Ashi indicators reflect the average dynamics of price movements and are calculated using a special formula.
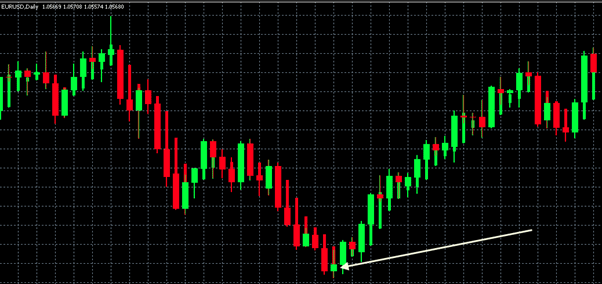
If we look at the Heiken Ashi chart, we see that it is much smoother than the usual “Japanese” chart. This is explained by the fact that average indicators are used here, and there are no sharp price increases.
These charts have no gaps, and you can rarely see familiar patterns such as the Morning Star or Hammer. The graph gives a general visualization of the trend rather than displaying specific factors due to which the price may "jump." There are also no sharp changes in the color of the candles, and the candles themselves are grouped by color.
Heiken Ashi Formula
If the trading platform provides the option of analyzing Heiken Ashi candles, it will calculate their parameters based on regular Japanese candles. To draw the Heiken Ashi bar, you need to calculate four values:
- Opening level (Heiken Ashi Open)
- Closing level (Heiken Ashi Close)
- Maximum candles (Heiken Ashi High)
- Candle minimum (Heiken Ashi Low)
The calculation is carried out using the following formulas:
- Heiken Ashi Open = 0.5*(Heiken Ashi (previous bar) + Heiken Ashi Close (previous bar))
- Heiken Ashi Close = 0.25*(Open + High + Low + Close)
- Heiken Ashi High = max (High, Heiken Ashi Open, Heiken Ashi Close); that is, the maximum value is selected from the three options.
- Heiken Ashi Low = min (Low, Heiken Ashi Open, Heiken Ashi Close); that is, the minimum value is selected from the three options.
When you look at the chart, it is essential to note that Heiken Ashi is calculated in real-time, so the data arrives with a slight delay. To mitigate this drawback, you can use the best Forex robots. They analyze the market in real time and provide the most accurate information.
Key Features of Heiken Ashi Strategy
Before you learn to understand the main signals of Heiken Ashi bars, you need to know the basic elements on which any strategy is built. So, first of all, you need to pay attention to sequences of candles of the same color. For example, if you see five or more green candles without a lower shadow on the chart, then it is evident that there is a bullish trend in the market. A similar situation occurs with a bearish trend. Only there will the candles be red without upper tails.
Also, with the help of lines, you can see the triangular patterns that form Heiken Ashi charts. The principle of their interpretation is the same as in Japanese candlesticks. If the price curve breaks through the triangle from below, this may indicate the beginning of a downtrend. And vice versa: an upward breakout signals a “bull” trend. These simple rules are the basics of the Heikin Ashi strategy.
Trading Signals with Heiken Ashi
As mentioned above, the trend on Heiken Ashi charts can be determined by the absence of shadows on the bars. It is the most important signal, which would be much more difficult to see on a traditional chart. Besides this obvious visual element, other practical Heikin Ashi secrets can help you make informed decisions. Let's look at some of them:
- If a bar opens at the level of the middle of the previous bar, this can be interpreted as a sign of trend stability.
- If subsequent candles are larger than the previous ones, this also indicates the current trend's strength. If the candles are decreasing in size, there is reason to believe that the trend is weakening.
- The presence of a Doji candle (with a small body and large wicks) can signal a trend reversal. This signal on the Heiken Ashi chart is stronger than on the traditional “Japanese” chart.
In general, it is essential to understand that the Forex Heiken Ashi strategy was developed so that a trader could quickly assess the strength of a trend and its possible change. Therefore, there are much fewer complex elements and patterns in it than on conventional charts. At the same time, Heiken Ashi signals are not sufficient for making effective decisions. To confirm the direction of the trend, you can use some additional indicators.
How to Combine Heiken Ashi with Other Indicators
A good addition to Heiken Ashi is momentum indicators. For example, you can take a moving average with a period of 50 and overlay it on the chart. In this case, you need to watch when the first Heiken Ashi candle crosses the MA(50) line. If this happens, the second bar will already be a signal to enter the market. A green candle crossing the moving average from bottom to top is a signal to buy, and a red candle going from top to bottom is a signal to sell.
Another tool that perfectly complements Heiken Ashi is the Ichimoku cloud. Even though the cloud was initially used with "Japanese" charts, it works great with "smoothed" candles.
A special Heiken Ashi oscillator can also be added to the trading platform. It displays the chart data in a separate window, which can be viewed together with the main price curve. Several options for additional indicators make it easier to understand and analyze Heiken Ashi candles.
Trading Forex With Heiken Ashi: Risk Management
Risk is a normal part of trading. Without risk, we would not be able to profit from price changes and use market volatility to our advantage. However, the effectiveness of trading is determined not only by profitable transactions but also by proper risk management. The better we can prevent losses, the more profits we will make. Heiken Ashi can be a trend forecasting tool and an effective risk management tool.
Thus, its main advantage is filtering market noise and false signals. If we can misinterpret some signals when analyzing the Japanese chart and enter the market prematurely, there are fewer such signals on Heiken Ashi. At the same time, there is one drawback of candles with an average value: they provide delayed data, which can negatively affect decisions. Experience and various tools are essential in risk management. Heiken Ashi could be one of them.
Forex Trading with Heiken Ashi: Pros and Cons
Before coming to a conclusion regarding the Heiken Ashi tool, let's list its main advantages and disadvantages. Let's start with the pros:
- Ease of use and clarity. The direction of the trend is immediately visible without any analysis.
- An excellent option for traders working on medium and long time frames. Since Heiken Ashi smooths out prices, you don’t have to watch the chart 24/7 and log into the platform much less often.
- Heiken Ashi candles are arranged in groups of the same color, and you don't need to study complex and hard-to-find patterns to understand what the current trend is.
- Heiken Ashi helps you enter a trade on time and not exit prematurely.
Now, let's note some of the disadvantages of the method:
- The chart is not suitable for scalpers and traders trading on shorter time frames (H4 and less).
- Smoothing can hide important details of the actual price chart, which, in turn, affects the accuracy of decisions.
A minority choose trading Forex with Heiken Ashi as their primary chart for market analysis. However, looking at it to quickly assess the situation is sometimes useful. Weigh the pros and cons and use this helpful tool correctly.
The Bottom Line
Heikin Ashi charts are great at filtering market noise and providing a clear picture of price trends. They were created to simplify analysis and help traders make decisions faster. However, like any technical analysis tool, these candles have their limitations. Undoubtedly, they can be built into your Heiken Ashi trading strategy, but you need to understand how they work and in what situations they are most effective.