数多くのFXインジケーターの中で、平均真のレンジ(Average True Range)は際立っています。その主な目的は資産価格の不安定性を測定することです。これは実際にはトレンドのベクトルについて何も言っていないが、単に変動のレベルを示しています。このメトリックはトレンド戦略で使用され、トレンド反転の確率を評価し、価格がフラットを離れる時点を決定するために使用されます。また、ストップロスやテイクプロフィット注文を設定するためにも使用され、チャネル戦略を使用して取引する際の間隔の幅を推定するためにも使用されます。質問がある場合は、この記事でATRインジケーターが説明されています。
トレードにおけるATRとは
平均真のレンジの定義は、1978年に書かれた画期的な書籍でW. Wilderによって最初に与えられました。ATRは単独で使用されることはめったにありませんが、目標が適切に配置されているかどうかを確認するのには非常に適しています。
これは価格変動の「速度」を示すオシレータータイプのインジケーターです。その主なアイデアは、ATRの値が増加すると、資産は高い取引活動を経験しており、現在のトレンドが続いているということです。ATRインジケーターの値が減少すると、市場のこの資産への関心が低下し、現在のトレンドが弱まり、反転の可能性が高まります。
略称では、Rangeは任意の時間枠(1時間ごと、4時間ごと、デイリーなど)の1つのバーの高値と安値の間の距離を指します。Trueというのは、ギャップが考慮されているという意味です。外国為替取引はほぼ絶えず行われていますが、週末には休憩もあります。土曜日と日曜日は、これらのギャップが形成される日です。ギャップは、中央銀行の金利発表、重要なニュースの公表など、他の場合にも発生する可能性があります。
平均真のレンジの動作原理
通貨ペアのボラティリティとは、価格の変動の振れ幅、つまり一定期間内に移動できる範囲を指します。この指標の平均値を明らかにすることで、トレーダーは選択した資産のポテンシャルを知ることができ、取引を開始するタイミングや逆に終了するタイミングを見つけることができます。
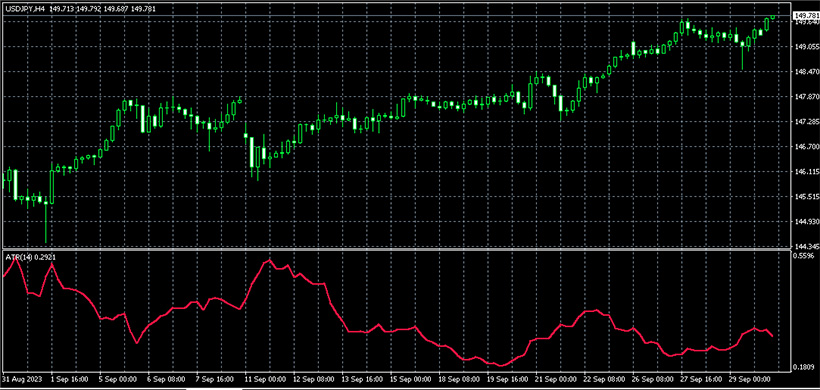
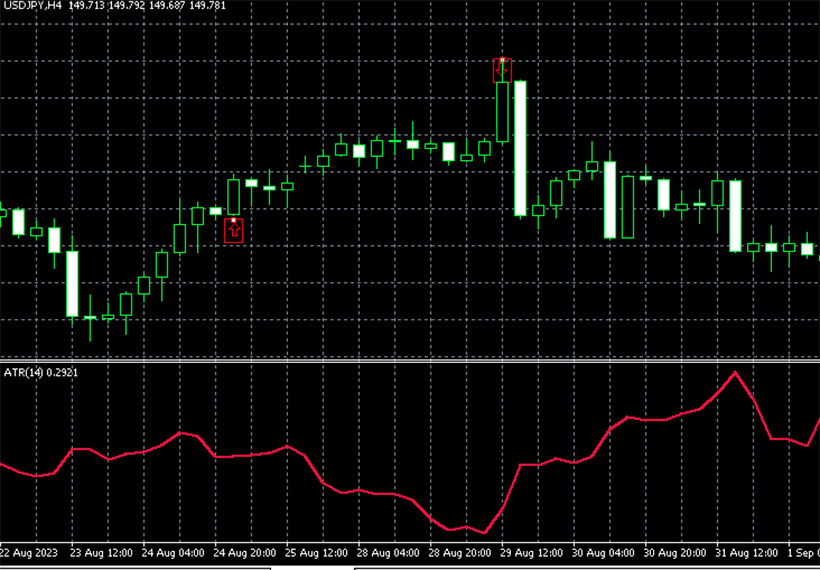
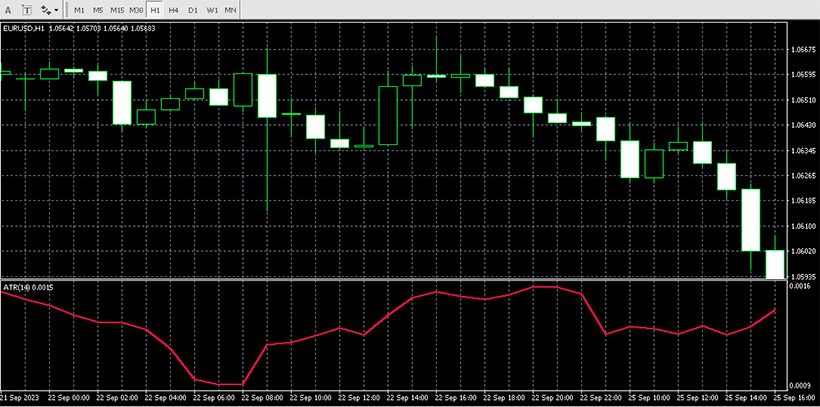
ATRインジケーターは、通貨ペアのチャートの下に別のボックスに配置されています。限られた範囲内で上下に変動する曲線で表されます。インジケーターの値は、終値を基に計算され、一定期間にわたって価格が示した局地的な極値も考慮されます。このインジケーターの発明者は、14本の連続したキャンドルの値を取ることを推奨しています。得られたポイントは平滑化され、移動平均を得るために使用され、インジケーターチャートに表示されます。
この指標は非常に使いやすく計算しやすいため、多くの他のテクニカルツールの基礎となっています。取引戦略にしばしば組み込まれ、あらゆる種類の市場で使用されています。
ATRの計算方法
平均真のレンジの計算は14期間に基づいています。期間の長さに関わらず(時間、日、週など)、式は同じです。たとえば、日足チャートでは毎日新しい値が計算され、分足チャートでは毎分計算されます。すべての値を図表にプロットすると、点が時間経過に伴うボラティリティの変化を示す曲線を形成します。
平均真のレンジの式を見つけるためには、まず一連の真のレンジ(TR)を計算する必要があります。TRは次の式を使用して計算されます:
TR = max(High(t) − Low(t), abs(High(t) − Close(t) − 1), abs(Low(t) − Close(t) − 1))
Where:
TR は期間 t の真のレンジであり、
High(t) は期間 t の最高価格、
Low(t) は期間 t の最低価格、
Close(t) − 1 は前の期間(t − 1)の終値、
max() は最大値を選択する操作、
abs() は絶対値またはモジュラスを取得する操作です。
この式は次の形に簡略化できます:
TR = max(High(t), Close(t) − 1) − min(Low(t), Close(t) − 1)
Where:
min() は最小値を選択する操作です。
必要な期間の TR 値を計算した後、指定された期間数にわたる Forex 平均真のレンジを取得できます。一般的な期間は 7 および 14 です。
平均値を計算する ATR の式は次のとおりです:
ATR = ((Prior_ATR x 13) + Current TR) / 14
Forex 取引での平均真のレンジの使用方法
グラフを使用すると、価格範囲が急激に拡大し始める瞬間が見えます。この特性は、ATR インジケーターの使用方法と目的を説明します:
- 短期戦略を構築するため。
- 市場参入の決定を下すため。マーカーが平均統計範囲の半分以上を通過した場合、トレンドの方向に取引を開始するのは遅すぎる可能性が高く、逆転を待つ方が良いでしょう。
- 利益目標を決定するため。利益確定はボラティリティ範囲内または範囲内に設定されます。たとえば、平均真の範囲指標の値が60ポイントの場合、取引のオープニング価格から45-50ポイントのレベルに利益を設定するのは意味があります。
- ストップ設定レベルを決定するため。ストップロスは価格変動範囲の外側に設定されます。各資産について、ATR指標Forexが調整される係数が個別に選択されます。
- フラットの瞬間を決定するため。平均ボラティリティと比較して値が低い場合、市場はフラットです。この要因は特定の戦略や戦術にとって有益である可能性があります。
- トレンドの終わりを決定するため。価格ラインが平均真の範囲を超えるほど、傾向が終了する可能性が高くなります。
ATRトレーディングの利点と制限
平均真の範囲は重要でかなり人気のある指標です。トレーダーや投資家はそれに多くの利点を見出しています。その中には以下が含まれます:
- すべてのギャップを考慮に入れた高度な客観的なボラティリティ測定。これにより、トレーダーは彼らのFX戦略やリスク管理に関係なく、情報に基づいた決定を行うのに役立ちます。
- このインジケーターはさまざまな目的やATRトレーディング戦略の基盤として使用できます。これにより、作業プロセスを向上させたい人々にとって非常に多目的な指標となります。
- 使いやすい。 ATRフォレックスは、簡単でわかりやすいメトリックであり、手元にあるチャートソフトウェアを使用して簡単に計算できます。トレーダーは、複雑な数学モデルやテクニカル分析技術の深い理解を必要としません。
ATRの利点を活用することで、リスクを管理し、取引機会を特定し、ATR戦略を最適化することを目指す投資家にとって、これは貴重なツールとなります。ただし、この指標のいくつかの欠点を述べることはできません:
- この指標は過去の価格変動に基づいているため、その価値は古いデータによって制限されます。その結果、将来の価格変動を予測する正確性が低くなる可能性があります。
- このメトリックは、資産に影響を与える他の市場要因についての情報を提供しません。トレーダーは、ATRと併用して他のテクニカルツールや分析手法を絶対に使用して、情報に基づいた取引の決定を行う必要があります。
- 値の解釈は、個々のトレーディングスタイルやトレーダーの好みに応じて異なる場合があります。したがって、効果的に使用するには、ある程度の取引経験が必要です。
- Forex ATRインジケーターは急激な価格変動やギャップの影響を受ける可能性があります。これらの要因により、ATRの読み取りが歪み、信頼性が低下することがあります。
ATR戦略のベストプラクティス
経験豊富なトレーダーは、ATRを他のテクニカルインストゥルメントと組み合わせて使用することを勧めています。また、正しい設定を行うことも重要です。MetaTrader 4や他の多くの人気のある取引プログラムを使用している場合は、簡単に変更できます。
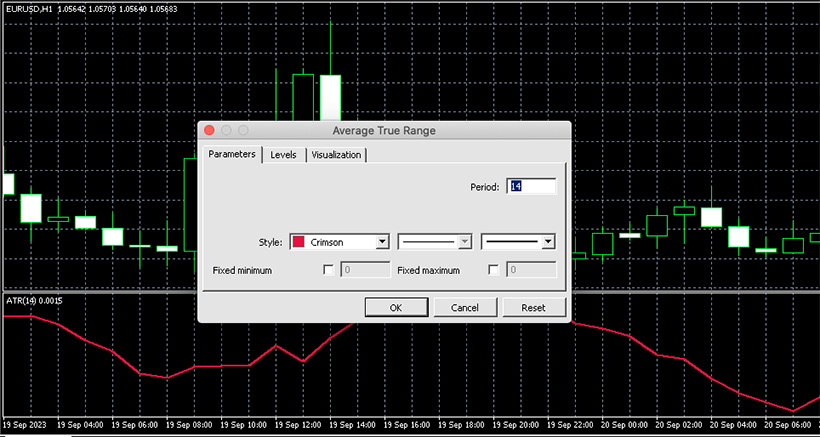
Forexでは、ATRは通常、デフォルト値である14の期間で設定されます。この指標のおかげで、ボラティリティを監視し予測するだけでなく、ダイバージェンス信号を追跡することもできます。つまり、チャート上で、ATRラインが減少するときに価格が新高値を形成したり(または新安値を形成し、ラインが上昇したりした場合)、おそらく市場にダイバージェンスがあるということです。つまり、トレーダーは動きに興味を失い、トレンドの継続に自信が持てないということです。しかし、価格が新高値を作り出し、ATRが同じように示す場合、取引参加者は現在の傾向の継続に自信を持っているということです。
フィルタリングを設定すると、すべての非トレンド価格変動を除外することができます。この場合、価格が範囲の中央のラインを越えた後に資産の動きの方向に取引が開始されます。この範囲は、2つの値(上と下)を加算して結果を半分に分けて計算します。範囲の中央が得られた後、その数値はATRインジケーターウィンドウに書き込まれ、ウィンドウに追加されます。
結論
ボラティリティ指標はプロのトレードには必要不可欠です。初心者トレーダーにとっては、他のツールと比較してあまり意味をなさないかもしれませんが、ATRについての知識はATRトレード戦略を開発する際に役立ちます。
ATRには過去のデータに縛られていることや人間の解釈が必要であるという些細な欠点がありますが、その利点により、リスクを管理しより良い決定を下すためにATRはトレーダーにとって多目的なツールとなっています。結局のところ、利点の数は著しく大きいです。
トレーダーは、ATR Forex が数百の他のツールのうちの1つに過ぎないことを覚えておくべきです。その中の多くは、最高のForexロボットと一緒に探索することができます。1つのインストゥルメントに基づいて取引の決定をするべきではありません。ただし、さまざまなテクニカル分析ツールの組み合わせを使用することで、トレーダーは市場状況をよりよく理解し、最終的には利益を最大化することができるでしょう。