Le candele giapponesi sono un modo molto conveniente per rappresentare i movimenti dei prezzi. Forniscono molti dettagli per l'analisi e la previsione. Oggi, la maggior parte dei trader utilizza questi pattern grafici per entrare nel mercato, chiudere la posizione, impostare ordini di stop-loss e per molte altre ragioni. La loro semplicità li ha resi una parte significativa dell'analisi tecnica del Forex.
In questo articolo, imparerai come leggere questi grafici, la loro storia e i pattern più popolari. Comprendere le candele giapponesi renderà le tue decisioni più efficienti e veloci. Alla fine, otterrai consigli per l'uso quotidiano dei pattern delle candele giapponesi.
Storia dei grafici a candele giapponesi
Ci sono diversi modi per visualizzare i movimenti dei prezzi su un grafico. Negli ultimi decenni, le candele giapponesi sono diventate il modo più comune per farlo. Sono sia semplici che versatili. Ma come sono arrivate nell'industria del trading?
La storia delle candele giapponesi è iniziata molto prima del Forex. I trader giapponesi usavano questo metodo per rappresentare i prezzi del riso nel XVIII secolo. Furono inventati da un uomo di nome Munehisa Homma. Nacque in una famiglia di commercianti di riso. Dopo la morte di suo padre, Munehisa Homma ottenne il controllo del capitale familiare e iniziò a pensare a come utilizzarlo in modo efficace.
Il commerciante studiò i prezzi del riso tenendo conto di tutta la storia del commercio del riso a Osaka. Analizzò le variazioni dei prezzi e i fattori psicologici che influenzavano i trader. Una profonda comprensione del trading rese Munehisa un commerciante di riso molto di successo. Nel tempo, divenne un consulente finanziario.
In seguito, ha creato un metodo chiamato oggi pattern di candele giapponesi. Ci è voluto molto tempo affinché arrivassero ai mercati occidentali e diventassero parte dell'analisi tecnica del Forex. È successo dopo la pubblicazione del libro di Steve Nison nel 1991. Il metodo si è rivelato più descrittivo rispetto alle solite barre e linee. Ora, scambiare candele giapponesi è pratica normale per ogni trader.
Comprensione dei pattern di candele giapponesi
Per comprendere i pattern di candele giapponesi, è importante essere familiari con i suoi elementi di base. Quindi, devi prestare attenzione al colore (di solito verde o rosso), alla dimensione del corpo, alle ombre e alla posizione. Ecco cosa significano:
- Il colore indica che tipo di candela è. Ci possono essere candele rialziste (verdi o bianche) e ribassiste (rosse o nere).
- La dimensione del corpo mostra la distanza tra il prezzo di apertura e di chiusura. Inoltre, è importante menzionare che le candele rialziste sono dirette verso l'alto, mentre le candele ribassiste si muovono verso il basso.
- Le ombre mostrano il massimo e il minimo. La loro lunghezza può fornire informazioni sul comportamento dei venditori e degli acquirenti.
- La posizione di una determinata candela può dire molto sui futuri cambiamenti di prezzo. Spesso, i prominenti pattern di candele giapponesi nel Forex segnalano inversioni di tendenza e si verificano in fondo a una tendenza al ribasso o in cima a una tendenza al rialzo.
Questi elementi possono fornire molte informazioni sul movimento del mercato. Di seguito, esploreremo in dettaglio i pattern a una candela. Alcuni pattern sono composti da due, tre e persino più candele. Se li usi insieme ad altri indicatori tecnici, hai una vera possibilità di aumentare i tuoi profitti.
Pattern di candele giapponesi comuni
Sorprendentemente, la collezione di pattern di candele giapponesi include dozzine di forme e combinazioni diverse. Facciamo una conoscenza più ravvicinata con le candele più conosciute:
- Marubozu. La caratteristica principale di questa candela è l'assenza di ombre. È composta solo dal corpo e può essere rialzista o ribassista. La forma indica che non c'è movimento di prezzo oltre il prezzo di chiusura e di apertura.
- Doji. Il corpo della candela è quasi assente. È rappresentato solo da una linea orizzontale. I prezzi di apertura e chiusura sono uguali. Ci possono essere alcune modifiche a questo modello, come Dragonfly o Gravestone. Il primo ha una lunga coda inferiore, e il secondo ha un'ombra sopra il corpo.
- Spinning top. È molto simile al Doji, ma la candela ha comunque un corpo stretto. Lunghe ombre rappresentano che l'intervallo di trading sul mercato è piuttosto ampio.
- Martello e Uomo Appeso. Hanno la stessa forma ma sono posizionati in luoghi diversi. Un martello si verifica sul fondo del trend ribassista. Segnala l'imminente trend rialzista. Un uomo appeso, al contrario, è posizionato sulla cima della curva rialzista.
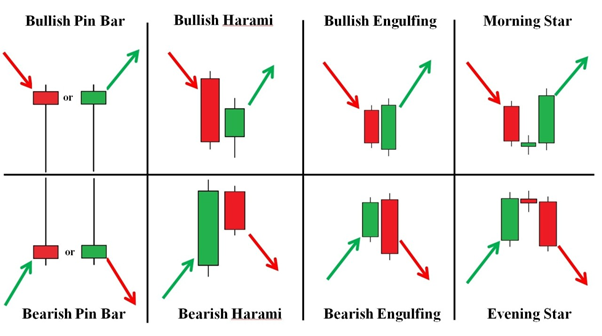
- Modello di engulfing. Può essere sia rialzista che ribassista. È formato da due candele giapponesi e indica un'inversione di tendenza. La prima candela è più piccola e si adatta completamente al corpo della seconda parte del modello. In questo caso, i trader dicono che la candela inghiotte il suo predecessore.
- Harami. È opposto al modello precedente per la sua forma. La prima candela è significativamente più grande della successiva. Tuttavia, il significato è lo stesso. Se vedi un harami nel trend ribassista, è un harami rialzista, e dà un forte segnale al cambiamento della curva dei prezzi.
- La stella della sera. Un altro modello di breakout che indica l'inversione di tendenza. Si verifica sulla cima di un trend rialzista ed è considerato un modello ribassista. Il suo gemello ha una forma speculare e si verifica sul fondo. Un tipo rialzista è chiamato stella del mattino.
- Three white soldiers è un altro modello rialzista che segnala un'inversione. Indica anche spesso la continuazione di una prossima tendenza. Il modello è composto da tre grandi candele verdi (o bianche), ciascuna delle quali apre e chiude più in alto della precedente. Il modello opposto è chiamato tre corvi neri.
Ogni modello menzionato può avere modifiche. Ci sono anche combinazioni più complesse che sono piuttosto difficili da notare a prima vista. Queste forme comuni sono sufficienti per iniziare ad analizzare il Forex giapponese a candela. Per una comprensione completa della scheda di frode dei modelli di candele giapponesi, considera la lettura del nostro articolo intitolato "16 Modelli di Candele Forex più Comuni". In seguito, acquisendo esperienza, questo processo diventerà quasi automatico.
Applicazione dei modelli di candele giapponesi nel trading Forex
Le candele giapponesi sono un ottimo strumento per l'analisi tecnica. Non hanno rivali tra gli altri metodi di rappresentazione grafica.
I corpi delle candele, le loro ombre e posizioni, se analizzati contemporaneamente, danno un'immagine chiara e olistica del comportamento del mercato. Ogni candela è individuale, ma possiamo distinguere diversi principi di base che possono essere applicati nel trading di candele giapponesi:
- I corpi lunghi con stoppie corte sono tipicamente la base per la costruzione di un nuovo trend. Segnalano il dominio degli acquirenti sui venditori o, viceversa, dei venditori sugli acquirenti. Spesso, i corpi di candele più lunghi si trovano all'inizio e alla fine di un trend. Se l'ordine è stato aperto sul trend, l'aspetto di elementi a corpo lungo è un segnale per chiudere l'affare.
- Le candele con corpi corti e stoppie lunghe si formano spesso quando un trend si inverte. Più grande è questo rapporto, più forte è il segnale. Ad esempio, un martello e un uomo impiccato dovrebbero avere una stoppia almeno cinque volte più lunga di un corpo. Questa particolarità rappresenta una tensione tra tori e orsi.
- Le candele di piccole dimensioni appaiono spesso durante i trend laterali. In questo momento, è possibile considerare di impostare livelli di stop-loss.
Suggerimenti per utilizzare efficacemente i modelli di candele giapponesi
Quando non sai come leggere le candele giapponesi, sembrerà subito che devi tenere molte informazioni in testa (modelli visivi delle candele, colori, dimensioni, combinazioni, ecc.). In realtà, tutto non è così difficile. Con l'esperienza, imparerai a vedere come si comporta il mercato.
Tuttavia, i principianti spesso hanno bisogno di un certo slancio o consigli per iniziare a fare trading in modo abile e redditizio. Ecco alcuni suggerimenti che puoi applicare subito:
- Utilizza consulenti software, ad esempio i migliori robot Forex. Non solo miglioreranno la tua strategia immediatamente, ma ti insegneranno anche a prendere decisioni migliori.
- Quando analizzi le candele giapponesi, utilizza la griglia di Fibonacci sul grafico. Questo indicatore rende molto più facile comprendere i modelli delle candele giapponesi.
- Controlla diversi intervalli temporali. Indipendentemente dalla tua strategia, cerca di essere consapevole dei grafici intraday, giornalieri e settimanali quando prendi una decisione.
- Esercitati con un conto demo se non sei sicuro della tua comprensione.
Il consiglio più importante: il mercato è imprevedibile. Non puoi fare una previsione infallibile del suo comportamento. Tuttavia, imparare i modelli delle candele giapponesi e utilizzarli con altri indicatori può aumentare notevolmente le tue probabilità.
La conclusione
Il grafico a candele è una grande invenzione dei commercianti giapponesi. Nel tempo, è diventato il miglior metodo per rappresentare i movimenti del mercato Forex. Fare trading con le candele giapponesi può darti grandi intuizioni e rendere la tua strategia più efficiente. Tuttavia, non puoi fare affidamento solo su di esse. È sempre consigliabile utilizzare un insieme di tecniche e indicatori. Quindi, impara i modelli di base a una e due candele, esercitati con un conto demo e inizia il tuo percorso di trading professionale!