Le figure a candela sono uno strumento di analisi tecnica relativamente raro. È stato utilizzato dai commercianti per oltre 200 anni ed è ancora estremamente popolare. Oggi, la maggior parte degli operatori di borsa, criptovalute e Forex lo incorpora nelle proprie routine di lavoro. La gamma di figure è aumentata notevolmente negli ultimi decenni. Se le combini con altri indicatori e oscillatori, otterrai uno strumento potente per la previsione dei prezzi.
Il trend è il tuo amico. Questo proverbio è ben noto alla maggior parte degli operatori. Continuiamo a guadagnare su un forte movimento al rialzo o al ribasso o entriamo abilmente sul mercato quando una curva dei prezzi si inverte. Le seguenti figure rialziste ti aiuteranno a determinare un momento favorevole per aprire l'ordine. Indicano che un trend ribassista si invertirà e che i tori dominano il mercato.
Figura Rialzista: Che cos'è?
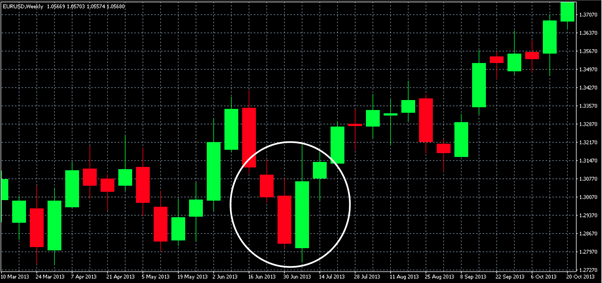
Ogni programma di trading rappresenta i movimenti dei prezzi con una sequenza di figure a candela. Ogni candela è composta da un corpo che indica il prezzo di apertura e chiusura e due ombre che mostrano massimi e minimi. Questo tipo di rappresentazione fornisce molte più informazioni sul comportamento del mercato rispetto a una semplice curva. Ad esempio, determinate combinazioni di candele possono dare chiare previsioni sul prezzo futuro. Anche se non hai molta esperienza nel trading, puoi ottenere un'analisi completa e consigli professionali dai migliori robot Forex.
Queste combinazioni sono chiamate figure. Le figure rialziste prevedono una continuazione di un trend al rialzo o un'inversione di un trend al ribasso. Possono essere composte da una, due, tre e, raramente, più candele. Di solito hanno un colore bianco o verde, a seconda del programma di trading che si utilizza. Le dimensioni dei corpi e delle ombre possono variare notevolmente.
I libri sull'analisi tecnica del Forex spiegano dozzine di questi schemi. Tutti loro hanno diversi livelli di affidabilità. Ricordarli tutti è un bel colpo, ma non è così necessario come ricordare quelli principali. Qui di seguito, incontrerai i sei schemi più comuni che ogni trader dovrebbe conoscere.
Perché i pattern di candele rialzisti sono importanti
I pattern di candele rialzisti sono uno strumento prezioso nelle mani dei trader esperti. Inoltre, possono diventare un punto di partenza per i principianti del Forex. È quasi impossibile immaginare un trader di successo che non incorpori candele di inversione rialziste o pattern di tendenza rialzista nelle proprie strategie. Ecco perché sono importanti:
- Un segnale potente per entrare in una posizione lunga. I pattern rialzisti possono significare che gli acquirenti prendono il sopravvento e il prezzo aumenterà.
- Un segnale per un livello di stop-loss. Molti trader considerano i pattern di inversione rialzisti come segnali affidabili per impostare un ordine di stop-loss.
- Un segnale di inversione. Possono esserci segnali molto chiari che la pressione dei venditori sta per finire e che gli acquirenti prendono l'iniziativa.
In generale, le candele giapponesi danno un'idea di cosa sia un'inversione rialzista e cosa stia generalmente accadendo sul mercato. Se hai una strategia di trend following, i pattern di candele rialziste saranno davvero utili per te.
Pattern di candele rialziste più comuni
Come abbiamo già detto, ci sono dozzine di pattern rialzisti e le loro modifiche. Ad esempio, Harami e Harami Cross possono essere classificati come pattern diversi ma hanno significati simili e differiscono solo leggermente nella forma. Le seguenti sei combinazioni coprono la maggior parte dei pattern rialzisti che puoi vedere sui grafici dei prezzi.
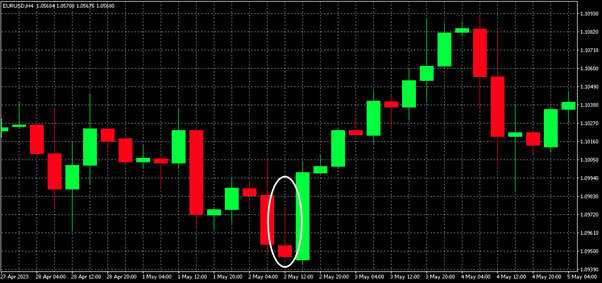
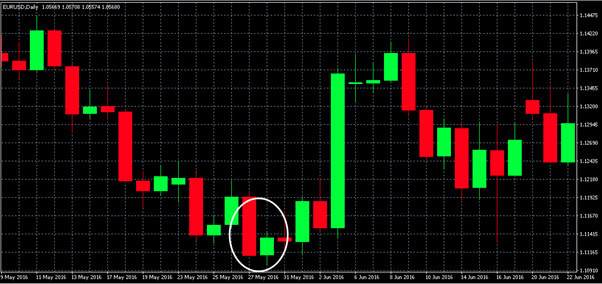
Pattern di copertura rialzista
I pattern di avvolgimento suggeriscono la fine di un trend. Possono esserci tipi ribassisti e rialzisti. Un pattern rialzista si verifica in fondo al trend ribassista. È composto da due candele. La prima candela ribassista è più piccola della successiva. La seconda candela è rialzista (di solito verde o bianca). È significativamente più grande in modo da avvolgere la prima candela ribassista.
La grande candela rialzista appare perché i tori iniziano ad acquistare attivamente un asset e la loro pressione provoca un cambiamento di tendenza. La affidabilità di questo pattern di candela rialzista dipende dal volume di mercato e da altri indicatori di trend al rialzo. In generale, puoi tenerne conto con fiducia se hai una strategia di inversione.
Martello e Martello Invertito
Martello e Martello Invertito sono le candele più significative nel grafico. Spesso si incontrano insieme e entrambe le forme indicano la stessa tendenza - una inversione rialzista. Il martello ha un piccolo corpo e un'ombra inferiore lunga. Al contrario, il martello invertito ha una lunga cima e un piccolo corpo inferiore.
La loro comparsa spesso segnala che il trend ribassista ha perso la sua forza e gli acquirenti hanno riacquistato il controllo. Anche se queste due figure hanno direzioni opposte, hanno lo stesso significato. La lunga ombra del primo martello mostra l'incapacità degli orsi di spostare i prezzi ancora più in basso. Interessantemente, il piccolo corpo di un martello invertito è anche un segnale di riduzione della pressione dei venditori.
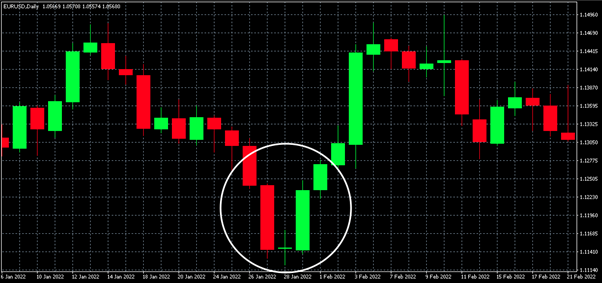
Stella del Mattino
La stella del mattino è un pattern a 3 candele molto notevole e preciso. Ha due candele di grandi dimensioni ai lati e una piccola tra di esse. Di solito la prima candela è ribassista. Rappresenta la fine di un trend ribassista. La piccola candela centrale può essere rossa (nera) o verde (bianca). Significa che la pressione dei venditori è ridotta. E l'ultima candela di inversione rialzista indica il nuovo trend. Il pattern mostra letteralmente la transizione fluida da una direzione all'altra.
Three White Soldiers
I tre soldati bianchi possono comparire sia dopo la fine di un trend ribassista che in un trend rialzista. Nel secondo caso indica che il momentum degli acquirenti è ancora forte e che si osserva uno dei pattern di candele rialziste di continuazione.
Il pattern si presenta come tre candele rialziste, una dopo l'altra. L'apertura della candela successiva è più alta della parte corrispondente della precedente.
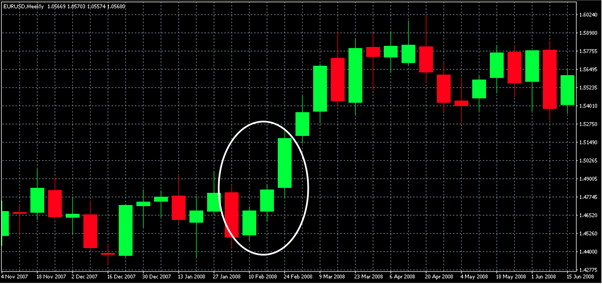
Il pattern stesso può essere utilizzato come strumento aggiuntivo per determinare il movimento dei prezzi. Puoi utilizzarlo insieme a Parabolic SAR, livelli di Fibonacci o strumenti simili per una maggiore precisione.
Piercing Line
Il pattern della linea di perforazione non ha una forma così distintiva come gli esempi precedenti. Consiste in una candela ribassista e una rialzista in linea. La seconda candela si apre più in basso rispetto alla chiusura della candela precedente. Indica una inversione rialzista. È importante notare che entrambe le candele dovrebbero essere di dimensioni medie o grandi. Quando noti questo pattern, è probabile che la curva ribassista salga.
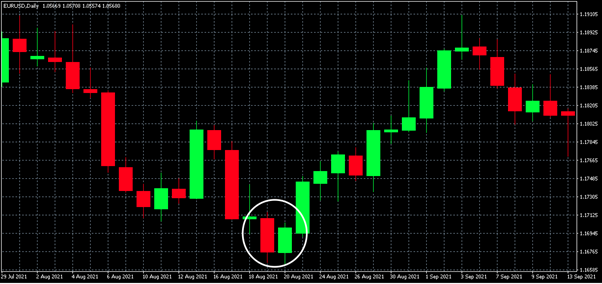
Bullish Harami
Il bullish harami è simile a un pattern di engulfing rialzista, ma ha dimensioni di candela opposte. La prima candela è più grande della seconda. Tuttavia, l'ordine delle candele rosse e verdi è lo stesso: il pattern inizia con una candela ribassista e termina con una rialzista. Tipicamente, la seconda candela si adatta all'interno del corpo della prima con le sue ombre. A volte, la parte rialzista non ha affatto un corpo (tipo doji). In questo caso, il pattern è chiamato harami cross. Harami indica spesso il ribaltamento del trend, ma è comunque consigliabile confermarlo con altri strumenti di analisi tecnica.
Suggerimenti per identificare le candele rialziste
Il suggerimento più ovvio che aiuta a identificare la candela rialzista è il suo colore. Nella maggior parte dei programmi di trading, hanno un colore predefinito bianco o verde. La candela rialzista è composta dal punto basso (la parte più bassa della sua ombra), il prezzo di apertura (il fondo del corpo), il prezzo di chiusura (la parte superiore del corpo) e l'ombra superiore. Un'analisi attenta di queste parti aiuta a identificare il tipo di candela e il pattern.
Il secondo fattore da considerare è la dimensione delle candele. Ad esempio, nei pattern di engulfing o harami, le dimensioni delle candele vicine differiscono notevolmente. Anche la loro posizione relativa è importante. Quindi, nel pattern dei tre soldati bianchi, la candela successiva dovrebbe essere più alta di quella precedente.
Esistono anche alcuni pattern di candele toro più complessi, composti da tre o più candele. Si consiglia di ricordarli e prestare attenzione alle forme che conosci. Ultimo ma non meno importante: un trend ribassista significa che in qualche momento la curva cambierà direzione. Guarda le candele e controlla i diversi intervalli di tempo. Molto probabilmente, noterai alcuni dei pattern rialzisti menzionati in precedenza.
Rischi e Limitazioni dei Pattern di Candele Toro
Ogni pattern rialzista può essere uno strumento prezioso per cogliere un'inversione di tendenza o una continuazione. Tuttavia, non dovrebbero essere considerati mezzi infallibili di previsione dei prezzi. Ogni strumento deve essere applicato con attenzione, tenendo conto dei rischi esistenti. Per ottenere il massimo dai pattern, tieni presente questi punti:
- Un pattern che prevede un'impennata potrebbe fallire a causa della volatilità di mercato o di eventi economici improvvisi. Per ridurre al minimo questo rischio, controlla gli indicatori di volatilità e considera il livello di rischio che puoi tollerare.
- Un pattern di candele toro può essere debole a causa di un basso volume di mercato e, quindi, non riuscire a materializzarsi.
- Anche se il pattern mostra un trend rialzista, potrebbero esserci altri fattori e indicatori forti che non confermano la previsione del pattern.
In generale, è importante ricordare che i pattern sono solo un altro utile strumento per aumentare i tuoi profitti. Tieni presente il contesto di mercato e gli altri indicatori e sviluppa una strategia che aumenti le tue probabilità.
Strategie per Sfruttare i Pattern di Candele Toro
Nelle sezioni precedenti, abbiamo affermato che quando si fa trading con pattern rialzisti, i rischi devono essere considerati attentamente. Le candele di inversione rialziste non possono essere la base della tua strategia, sono solo una parte di essa. Per rendere il tuo piano di trading olistico e di successo, puoi arricchirlo con i seguenti trucchi:
- Prima di entrare nel commercio, attendi la conferma. Assicurati che sia apparsa una nuova figura.
- Utilizza il maggior numero possibile di indicatori di analisi tecnica. Imposta il tuo software per visualizzare i parametri più significativi come MACD, media mobile, Parabolic SAR, ecc.
- La lunghezza delle ombre e le dimensioni del corpo sono importanti. Ad esempio, l'ombra di un martello dovrebbe essere approssimativamente cinque volte maggiore del corpo. Altrimenti, la figura potrebbe dare un segnale falso.
- Più fai trading, maggiore sarà la tua comprensione delle figure. Sviluppa continuamente la tua strategia e impara le sfumature delle diverse formazioni di candele rialziste di inversione.
Il Succo del Discorso
Su ogni timeframe, vedrai figure di candele rialziste e ribassiste. Comprendere le figure di candele non aprirà la porta a fonti di denaro illimitate ma può migliorare significativamente la tua strategia di trading. Se combini osservazioni attente, analisi accurata e un insieme di altri indicatori, aumenterai notevolmente la tua efficienza. Le più comuni figure di candele rialziste di inversione ti aiuteranno a determinare i momenti di inversione e i periodi in cui l'andamento rialzista è forte e affidabile.