Um das zukünftige Verhalten einer Person vorherzusagen, müssen Sie ihre Stimmung bewerten. Sie kann ziemlich volatil sein, beeinflusst aber stark und manchmal sogar direkt das Handeln einer Person. Das Gleiche gilt für die Märkte: Um die weitere Bewegung des Preises eines Vermögenswerts vorherzusagen, müssen Händler die Stimmung des Marktes oder die Bereitschaft von Käufern und Verkäufern einschätzen, Geschäfte zu den aktuellen Preisen abzuschließen.
Die Candlestick-Analyse, die von Händlern seit mehreren Jahrhunderten effektiv eingesetzt wird, hilft dabei, die Psychologie der Kursbewegungen zu entschlüsseln. Lesen Sie den Artikel, um herauszufinden, warum 3 Candlestick-Muster die nützlichste Technik zur Analyse der Marktsentiment sind, und welche Schlussfolgerungen daraus gezogen werden können, um die Effizienz des Handels zu verbessern.
Verständnis von Triple Candlestick-Mustern
Eine der Hauptaufgaben der technischen Analyse besteht darin, optimale Zeiträume für das Öffnen und Schließen von Handelspositionen zu bestimmen. Je genauere analytische Werkzeuge Sie verwenden, desto mehr Nutzen können Sie aus dem Geschäft ziehen.
- Die Untersuchung einer einzigen Kerze gibt dem Händler wesentliche Informationen wie den Markttrend - bullish oder bearish, den Preis des Vermögenswerts zum Zeitpunkt des Öffnens/Schließens des Handels und den minimalen und maximalen Preis, zu dem der Vermögenswert gehandelt wurde.
- Doppel-Candlestick-Muster ermöglichen es Ihnen, nicht nur ein Signal, sondern auch dessen Bestätigung zu erhalten, was sie zu einem genaueren Werkzeug für die Marktanalyse macht.
- Das 3-Kerzen-Muster ist jedoch das zuverlässigste für die Vorhersage des zukünftigen Marktverhaltens, da es die Art des Handels während von 3 aufeinanderfolgenden Handelssitzungen berücksichtigt.
Daher, wenn Sie einen garantierten Gewinnhandel erzielen möchten, sollten Sie genau die Kombination von 3 Kerzen analysieren, die die Fortsetzung oder Umkehrung des Trends anzeigen. Und um sich bei Ihrer Analyse nicht zu irren, verlassen Sie sich auf die besten Forex-Roboter, die alle Arten von Kerzenanalyse perfekt durchführen.
Die häufigsten dreifachen Kerzen
Da jede Kerze bis zu vier Indikatoren enthält, werden Kombinationen von drei Kerzen Millionen von Mustern ergeben. Nur wenige von ihnen sind jedoch für den Handel signifikant, da sie sich während ihrer Anwendung als zuverlässig erwiesen haben. Lernen Sie die beliebtesten von ihnen kennen und bewerten Sie den heuristischen Wert von dreifachen Kerzenmustern.
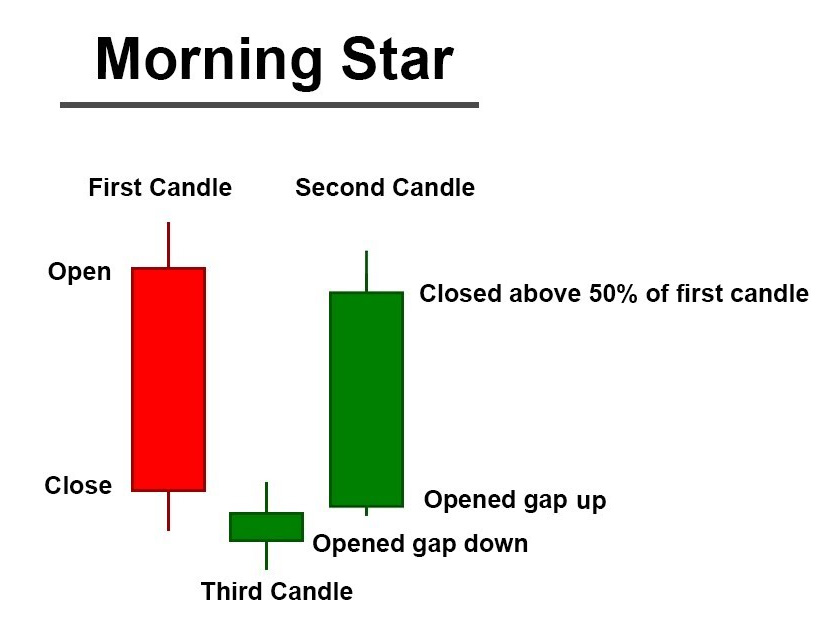
Morgenstern
Das Wachstum des Marktes gleicht dem Aufgang der Sonne. Deshalb wurde der Trendwechsel von bärisch zu bullisch so romantisch genannt. Er besteht aus 3 miteinander verbundenen Kerzen:
- Eine lange bärische Kerze ist wie eine lange Nacht.
- Eine kurze bärische oder bullische Kerze zeigt einen Abwärtstrendstopp an.
- Eine lange bullische Kerze ist ein Vorbote eines Aufwärtstrends.
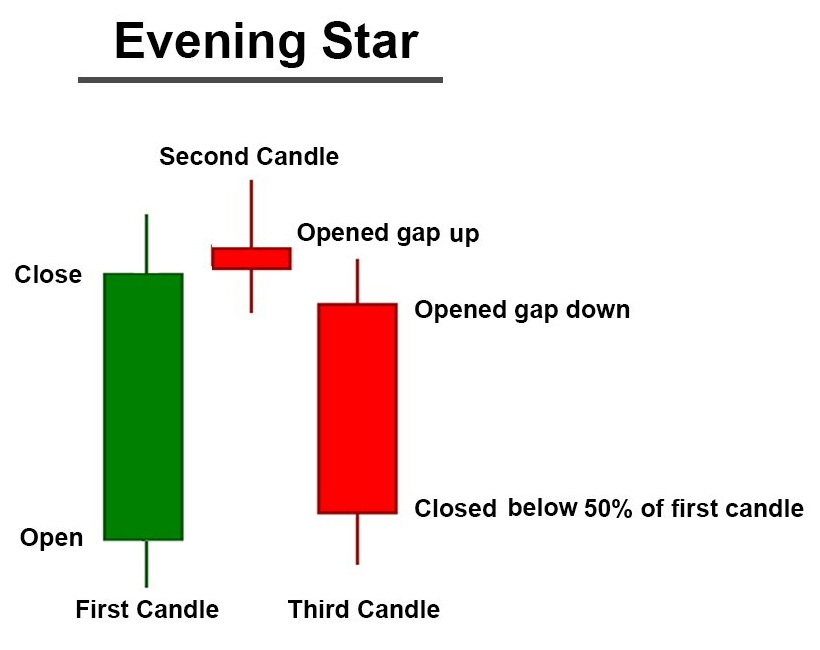
Abendstern
Ein bevorstehender bärischer Trend wird durch das entgegengesetzte Muster vorhergesagt:
- Die erste Kerze ist lang bullisch, was auf die Dominanz der Käufer hinweist.
- Die zweite Kerze ist kurz bullisch oder bärisch und zeigt Marktunsicherheit und Verkaufsdruck.
- Die dritte Kerze ist lang bärisch und bezeugt den Sieg des Abwärtstrends.
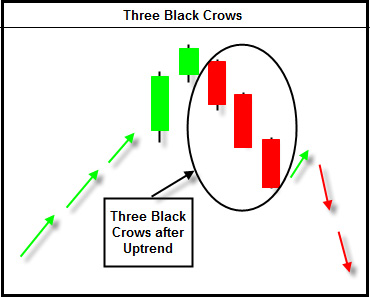
Drei schwarze Krähen
Das Ende eines Aufwärtstrends wird von drei aufeinander folgenden bärischen Kerzen vorhergesagt. Da sie alle drei schwarz sind, inspirierte dies die Händler zu einem so eloquenten Namen für den Indikator. Die zweite und dritte Kerze bilden sich unterhalb der vorherigen, was darauf hindeutet, dass die pessimistische Stimmung auf dem Markt ernsthaft Einzug gehalten hat, was bedeutet, dass es Zeit ist, Verkaufsaufträge zu platzieren.
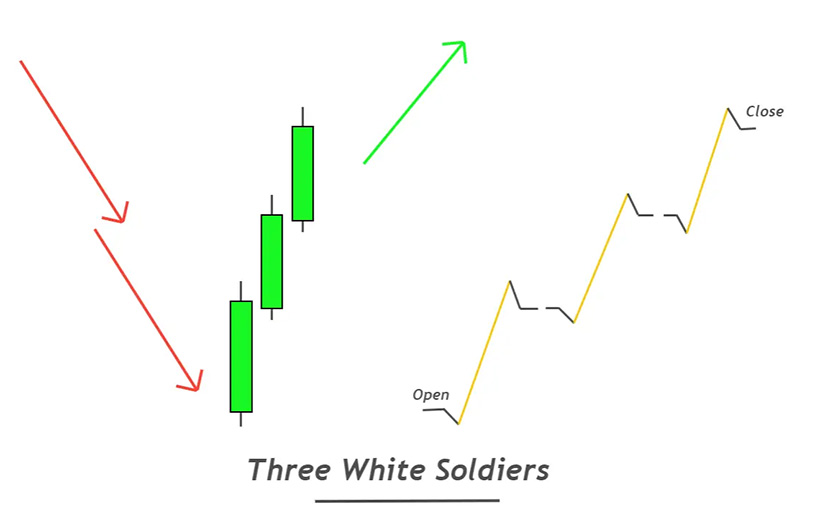
Drei weiße Soldaten
Dieses Muster ist das genaue Gegenteil der drei schwarzen Krähen, da Sie drei weiße Kerzen sehen werden, die sich nacheinander anschließen. Jede nachfolgende Kerze bildet sich innerhalb des Körpers der vorherigen und steigt darüber hinaus. Dies signalisiert eine Rückkehr zum Bullenmarkt, was bedeutet, dass Sie Kaufaufträge platzieren können.
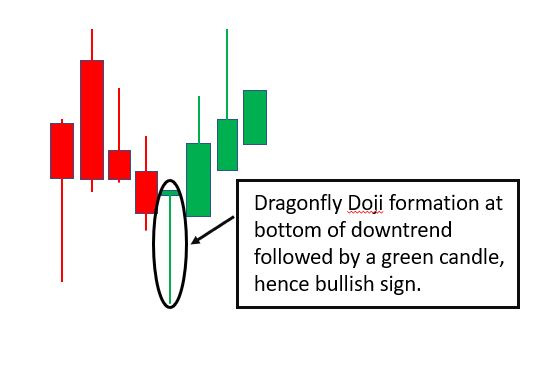
Doji
Das dreifache Kerzenmuster kann auch eine Marktunsicherheit anzeigen, wenn der Trend noch nicht umgekehrt ist, aber Sie sich darauf vorbereiten müssen. In einer solchen Situation sehen Sie zwei Kerzen unterschiedlicher Farben an den Seiten und eine Kerze mit einem dünnen Körper und langen Schatten innerhalb des Musters. Dies bedeutet, dass der Handel fast auf dem gleichen Niveau eröffnet und geschlossen wurde.
Wie man mit Triple-Candlestick-Mustern handelt
- Die Kerzenanalyse ist ein eigenständiger Zweig der technischen Analyse, auf den Sie sich verlassen können, wenn Sie Bestellungen aufgeben, da sie auf den etablierten drei Kerzenmustern basiert.
- Sie kann auch zusätzlich zu anderen technischen Analysemethoden verwendet werden, um Signale zu bestätigen. Um Sie vor falschen Signalen zu schützen, können Sie die Erkennung dieser Muster durch die Schätzung des Handelsvolumens unterstützen.
- Um das Risiko beim Handel auf der Grundlage der Kerzenanalyse zu minimieren, setzen Sie Stop Loss und Take Profit. Jeder Fall sollte separat analysiert werden, abhängig vom spezifischen Kerzenmuster, aber im Allgemeinen können sie 10 Pips über oder unter dem letzten festgelegten lokalen Maximum für Take Profit und 10 Pips darunter für Stop Loss gesetzt werden.
Beschränkungen von Dreifachkerzen in Forex
Wenn Sie sich die 3 Kerzenmuster einzeln ansehen, mag Ihnen alles offensichtlich erscheinen. Aber auf Preisdiagrammen werden Sie Kerzen sehen, die viele Muster bilden. Ihre Vielfalt kann selbst Profis manchmal verwirren, geschweige denn Anfänger. Daher ist es am besten, die besten Forex-Roboter zu verwenden, um keine Zeit und kein Geld für falsche Signale zu verschwenden.
Das Fazit
Wenn Sie mit der Kerzenanalyse beginnen, versuchen Sie nicht, alle Kombinationen abzudecken. Es ist besser, nicht mehr als 10-12 der effektivsten Muster auszuwählen, die Sie leicht auf den Diagrammen erkennen können. Platzieren Sie anfangs keine großen Bestellungen, sondern beachten Sie das Auftreten dieses Musters, treffen Sie eine Vorhersage und sehen Sie, wie sich der Preis weiter verhält. Und wenn Ihre Vorhersage mit der tatsächlichen Preisbewegung übereinstimmt, können Sie zu einem selbstbewussten Handel übergehen.