Jeder Händler möchte eine Umkehrung des Kurses rechtzeitig erfassen. Schließlich werden sie in diesem Fall in der Lage sein, zu einem frühen Zeitpunkt eines neuen Trends in den Markt einzusteigen und maximalen Gewinn zu erzielen. Oft wird für die Vorhersage von Umkehrungen und die Ermittlung von Einstiegspunkten das Konzept der Divergenz verwendet. Dieser Artikel gibt eine ausführliche Erklärung, was Divergenz im Forex-Handel ist, wie man sie erkennt, wie man sie auf Charts verwendet und welche Indikatoren dafür am besten geeignet sind.
Was ist Divergenz im Forex?
Divergenz ist eines der Schlüsselkonzepte in der technischen Analyse. Sie zeigt die Diskrepanz zwischen der Kursrichtung und der Richtung des gewählten Indikators an.
Im Kern ist Divergenz im Forex eine Reaktion auf die sich ändernde Marktsentiment. Manchmal kann sie jedoch auch aus Trägheit nach bemerkenswerten Finanzereignissen resultieren. Divergenz ist ein relativ seltenes Ereignis, bietet jedoch erhebliche Vorteile für Händler, die wissen, wie man sie effektiv nutzt.
Einige Händler glauben, dass Divergenz ein fast 100%iges Signal zur Eröffnung der Position ist. Einige halten es für ziemlich riskant. Tatsächlich haben beide Aussagen ihren wahren Kern.
Bullische Divergenz
Es gibt zwei mögliche Richtungen der Kursbewegung auf dem Markt - aufwärts und abwärts. Entsprechend versuchen alle Händler, einen bullischen oder bärischen Trend rechtzeitig zu erfassen. Die Überwachung der Forex-Divergenz kann dabei erfolgreich helfen. In jeder Richtung kann die Divergenz regulär, versteckt und erweitert sein.
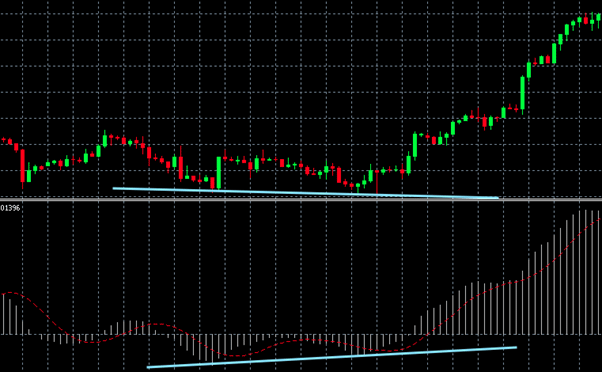
Um eine reguläre bullische Divergenz im Forex zu identifizieren, müssen wir die Tiefs des Preisdiagramms und des Indikatordiagramms betrachten. Eine typische bullische Divergenz tritt auf, wenn das Preisdiagramm ein zweites niedrigeres Tief erreicht und das Indikatordiagramm ein zweites höheres Tief erreicht. Wenn der Indikator eine Divergenz zeigt, ist dies ein Signal für eine mögliche Aufwärtsbewegung, die genutzt werden kann, um eine Kaufposition zu eröffnen.
Verdeckte Divergenz steht im Gegensatz zu einem regulären Typ. Sie deutet auf die Fortsetzung des Trends hin, anstatt auf seine Umkehr. Um sie zu identifizieren, müssen Sie auch auf die Tiefs des Preisdiagramms und des Indikatordiagramms achten. Sie tritt auf, wenn die Preislinie nach oben verläuft und höhere Tiefs bildet. In diesem Fall zeichnet der Indikator, der eine Divergenz anzeigt, ein niedrigeres Minimum.
Erweiterte Divergenz ist der seltenste Typ. Bei ihr haben Indikatoren unterschiedliche Spitzen, und Preis-Hochs oder -Tiefs liegen ungefähr auf dem gleichen Niveau (der Effekt eines doppelten Hochs oder doppelten Tiefs tritt auf). Um eine erweiterte bullische Divergenz zu identifizieren, müssen Sie auf die Tiefs achten: Der Preis bildet ein doppeltes Tief, und im Indikatordiagramm wird das zweite Tief viel höher sein als das erste.
Bärische Divergenz
Ein reguläre Divergenz tritt auf, wenn das Preisdiagramm ein höheres zweites Hoch bildet und der Indikator ein niedrigeres zweites Hoch bildet. Wenn der Indikator eine Divergenz anzeigt, ist dies ein Signal für eine mögliche Abwärtsbewegung, das wir nutzen können, um eine Verkaufsposition zu eröffnen.
Verdeckte bärische Divergenz sieht so aus: Der Preis aktualisiert das niedrigere Maximum, und der Oszillator hingegen tendiert nach oben. Diese Situation ist ebenfalls ein guter Grund, um eine Short-Position zu eröffnen.
Um eine erweiterte Divergenz in einem Bärenmarkt zu erkennen, sollten Sie sich auch auf die Hochs konzentrieren. Bei diesem Typ werden zwei benachbarte Preispeaks ungefähr auf dem gleichen Niveau liegen (Doppeltop). Aber der Indikator wird ein niedrigeres zweites Peak anzeigen.
Arten von Divergenz-Indikatoren
Viele Anfänger sind verwirrt über die Vielzahl verschiedener Divergenzindikatoren. Trotz ihrer Vielfalt erfüllen sie jedoch alle die gleiche Funktion - sie suchen nach Richtungsabweichungen und benachrichtigen den Händler darüber. Also, welchen soll man wählen? Dieser Artikel wird sich mit den Standardindikatoren befassen, die auf der MT4-Plattform verfügbar sind. Es gibt jedoch einige benutzerdefinierte Tools, die Sie auf Ihr Gerät herunterladen können.
Was soll man wählen - einen klassischen Indikator oder eine benutzerdefinierte Lösung? Ihre Ziele werden Ihnen helfen, diese Frage zu beantworten. Klassische Indikatoren werden seit vielen Jahren verwendet. Sie sind durch die Zeit erprobte Algorithmen, die von Millionen von Händlern getestet wurden. Oft konzentrieren sie sich auf große Zeiträume (ab H4). Gleichzeitig können sich viele benutzerdefinierte Instrumente auf kurze Zeiträume konzentrieren. Im Folgenden werden wir uns die wichtigsten Tools zur Bestimmung von Divergenzen ansehen, wie z.B. MACD, RSI, Stochastik-Oszillator und Momentum-Indikator.
MACD (Moving Average Convergence Divergence)
Laut vielen Händlern ist der MACD der beste verfügbare Forex-Divergenzindikator. Warum entstand eine solche Meinung über diesen bestimmten Algorithmus? Es ist ganz einfach: Das Tool hat sich in den letzten 30 Jahren sehr gut bewährt. Es wurde erfolgreich eingesetzt, als der Einzelhandelshandel noch nicht üblich war. MACD signalisiert Änderungen im Markt präzise. Schon der Name des Indikators weist auf seine Hauptfunktion hin: Moving Average Divergence Convergence.
Der Indikator verwendet zwei gleitende Durchschnitte mit unterschiedlichen Perioden. Dies ermöglicht es Ihnen, Linienkreuzungssignale zu erhalten - eine klassische Benachrichtigung im Handel. Der Indikator selbst zeigt diese Linien jedoch nicht im Handelsterminal an, sondern gibt dem Händler Informationen über den Abstand zwischen ihnen in Punkten. Er wird durch ein Diagramm dargestellt, das um den Nullwert in beide Richtungen schwankt. Ein Anstieg des Diagramms über Null deutet auf einen bullischen Trend hin, und ein Rückgang des Diagramms zeigt an, dass es einen bärischen Trend auf dem Markt gibt.
Es ist wichtig zu beachten, dass dieser Indikator seine hohe Genauigkeit den ziemlich großen Perioden gleitender Durchschnitte verdankt. Einerseits verlangsamt dies den Fluss von Signalen, und es gibt weniger davon. Andererseits erhalten wir einen genaueren Mechanismus zur Identifizierung von Divergenzen. Deshalb wird der MACD oft als Benchmark-Divergenzindikator bezeichnet.
RSI (Relative Strength Index)
Dies ist ein vielseitiger Momentum-Oszillator, der zu einem unverzichtbaren Werkzeug im Arsenal des Forex-Händlers geworden ist. Entwickelt von J. Wells Wilder Jr. identifiziert der RSI die Rate der Preisbewegungen. Er verwendet die Skala von 0 bis 100 und bietet Einblicke in die zugrunde liegenden Stärken oder Schwächen von Währungspreistrends. Dieser Indikator eignet sich besonders gut zur Identifizierung von überkauften oder überverkauften Bedingungen im divergenten Forex-Markt. Die Divergenz wird gemäß dem Standard-Schema mit der Diskrepanz zwischen Extremen bestimmt.
Stochastischer Oszillator
Der stochastische Oszillator ist ein Indikator, der Ende der 1950er Jahre eingeführt wurde. Er dient als wichtiger Indikator für das Forex-Divergenz-Trading. Er basiert auf der Annahme, dass Schlusskurse dazu neigen, nahe an den Extremen der jüngsten Preisbereiche während eines Auf- oder Abwärtstrends zu schließen. Ein stochastischer Oszillator vergleicht den Schlusskurs eines Währungspaares mit seinem Preisbereich über einen festgelegten Zeitraum (normalerweise 14) und liefert einen Wert zwischen 0 und 100.
Der stochastische Oszillator kann als der zweitbeliebteste Indikator zur Ermittlung von Wendepunkten bezeichnet werden. Dieser Indikator zeichnet sich durch kurze Perioden aus, die für klassische Algorithmen nicht ganz vertraut sind. Einerseits beeinträchtigt dies die Statistik und Qualität der Signale in gewissem Maße. Andererseits erhalten wir einen Indikator, der sehr reaktionsschnell auf Richtungsänderungen reagiert.
Für MT4 ist es Standard und muss nicht heruntergeladen werden. Besteht aus Linien, die sich periodisch schneiden und Signale erzeugen. Im Falle einer Divergenz unterscheidet sich der Aktionsplan jedoch. Wir betrachten beide Linien als eine, da der Abstand zwischen ihnen relativ gering ist. Wir interessieren uns für die Momente, in denen sich die Linien schneiden. Die Hochs und Tiefs, die durch solche Schnittpunkte gebildet werden, können analog dazu betrachtet werden, wie die Tiefs und Hochs auf dem MACD-Indikator gebildet werden.
Momentum-Oszillator
Dieser Indikator wurde vom talentierten französischen Mathematiker Paul Emile Appel erstellt, der der Vater vieler genialer technischer Geräte ist und Autor von mehr als hundert Büchern und Artikeln über Analyse, Geometrie und Mechanik ist. Die Indikatorwerte schwanken um eine zentrale Achse, die je nach den aktuellen Indikatoreinstellungen angezeigt werden kann oder nicht.
Der Momentum-Indikator ist ein vielseitiger Indikator und kann auf verschiedene Weisen verwendet werden. Er kann zur Bestätigung des Trendbestätigung und auch zur Anzeige einer Umkehrung verwendet werden. Die Aufgabe eines Traders besteht darin, das aktuelle Marktgefühl zu verstehen und das geeignetste Indikatorsignal im Gesamtkontext zu verwenden.
Normalerweise erscheint der Momentum-Indikator in einem Kasten am unteren Rand des Diagrammpanels. Wie korreliert er mit der Divergenzdefinition im Forex? Wenn die Preise auf einem Diagramm ein neues Hoch erreichen, das höher ist als das vorherige, und der Momentum zu diesem Zeitpunkt ein neues Hoch auf seinem Diagramm erreicht, das jedoch niedriger ist als das vorherige, bedeutet dies, dass bald eine Abwärtsumkehrung beginnen könnte. Das gleiche Prinzip gilt für eine bullische Umkehrung, aber Sie müssen sich die Tiefs der Diagramme ansehen.
Identifizierung von Divergenz in Forex-Diagrammen
Unter Verwendung eines bullishen Trends als Beispiel betrachten wir diese Situation. Nach langanhaltendem Wachstum beginnt ein Rückgang. Normalerweise ist er ziemlich großflächig. Kurzfristige überverkaufte Bedingungen treten am Markt auf und es bildet sich ein nach oben gerichteter Rebound. Käufer werden wieder aktiv, der Preis aktualisiert sein Maximum. Es ist nicht möglich, weit zu gehen, und danach wendet sich der Markt endgültig nach unten. Zwei aufeinanderfolgende Spitzen erscheinen auf dem Chart.
Die betrachteten Indikatoren sind nützlich, da sie solche Momente zeigen. Sie geben ein Signal in Form von Divergenz. Um sie zu sehen, ziehen Sie einfach gerade Linien zwischen den Hochs oder zwischen den Tiefs. Wenn eine Divergenz auftritt, werden sich solche Linien auseinander bewegen. Sie können auch die besten Forex-Roboter verwenden. Sie bieten Benutzern umfassende Analysen, einschließlich der Divergenz und Dutzender anderer Indikatoren.
Forex-Divergenzhandelsstrategien
Bei jeder Forex-Divergenzstrategie muss der Händler auf den Moment warten, in dem das Muster gebildet wird. Die Tatsache, dass der Chart gestiegen ist und der Indikatorwert eine Divergenz zeigt, kann noch nicht als unser Signal betrachtet werden. Es ist notwendig, auf eine Korrektur zu warten (das Vorhandensein von zwei Spitzen), und erst dann können wir mit Zuversicht sagen, dass dies wirklich eine Divergenz ist. Wie sieht das in der Praxis aus? Lassen Sie uns das Schritt für Schritt am Beispiel eines bärischen Trends betrachten:
- Der Markt bewegt sich nach unten und bildet ein Tief; nach der Korrektur erscheint ein weiteres Tief, und das Minimum wird aktualisiert. Gleichzeitig zeigt der Oszillator kein neues Tief, und wir sehen eine Divergenz.
- Der Preis beginnt zu steigen, und der Indikatorwert steigt ebenfalls.
- Im Moment, in dem der Preis das Niveau des ersten Tiefs überschreitet, können wir sagen, dass das Divergenzsignal bestätigt ist. Sie können einen Kauf abschließen.
Das Fazit
Die Divergenz wird auf dem Devisenmarkt Forex weit verbreitet eingesetzt, um eine wahrscheinliche Trendumkehr zu bestimmen. Ihre weit verbreitete Verwendung wird durch ihre einfache Handhabung und ihre recht hohe Genauigkeit erklärt. Der Handel mit Chartdivergenzen im Forex wird durch das Vorhandensein bestimmter Indikatoren auf allen Handelsplattformen erleichtert.
Allerdings sollte man nicht zu sehr an ein einzelnes Signal glauben. Es ist wichtig, es in verschiedenen Zeitintervallen zu überprüfen und auch andere technische und fundamentale Analysetools zu verwenden. Außerdem ist es für Anfänger besser, zu lernen, Divergenzen auf einem Demokonto zu erkennen, und erst danach damit zu beginnen, echtes Geld zu riskieren.